Pattern-Based Discovery
Pattern-Based Discovery allows you to discover a specific business service by selecting a pre-defined pattern. This method gives you full control over the discovery criteria and is ideal when you know exactly which service you want to map.
What are Service Patterns?
Service Patterns are pre-configured templates that define how to identify specific business services. Each pattern contains:
- Process signatures: Executables that uniquely identify the service
- Software keywords: Installed applications associated with the service
- Hostname patterns: Naming conventions for service servers
- Port ranges: Network ports used by the service
- Component tiers: Primary (core) vs. Dependency (supporting) classification
Available Patterns
The system provides patterns for common business services:
| Category | Examples |
|---|---|
| Enterprise | SAP ERP, Oracle EBS, Microsoft Dynamics |
| Security | CyberArk PAM, Active Directory, SIEM |
| Database | Oracle Database, Microsoft SQL Server, PostgreSQL |
| Monitoring | SolarWinds, Prometheus, Nagios |
| Microsoft Exchange, Postfix | |
| Web | IIS, Apache, Nginx |
Starting Pattern-Based Discovery
Step 1: Access the Business Service Analyzer
- Navigate to CMDB in the left sidebar
- Click on Business Service Analyzer
- Click "Analyze a Business Service" button
Step 2: Select a Service Pattern
- Browse the pattern library by category
- Click on the pattern card to select it (e.g., "SAP ERP System")
- The system automatically populates matching criteria
Step 3: Review Discovery Criteria
Before running discovery, review the populated criteria:
- Processes: Executables that identify the service (e.g.,
disp+work,sapwebdisp,jstart.exe) - Software: Installed applications associated with the service
- Ports: Network ports used by the service
You can modify these criteria if needed for your specific environment.
Step 4: Run Discovery
Click "Proceed to Discovery" to start the analysis. The system performs:
- Phase 1 - Primary Discovery: Finds core service components matching the pattern
- Phase 2 - Dependency Discovery: Identifies supporting infrastructure connected to primary servers
Understanding Discovery Results
After discovery completes, you'll see a comprehensive view of your discovered infrastructure.
Discovery Summary
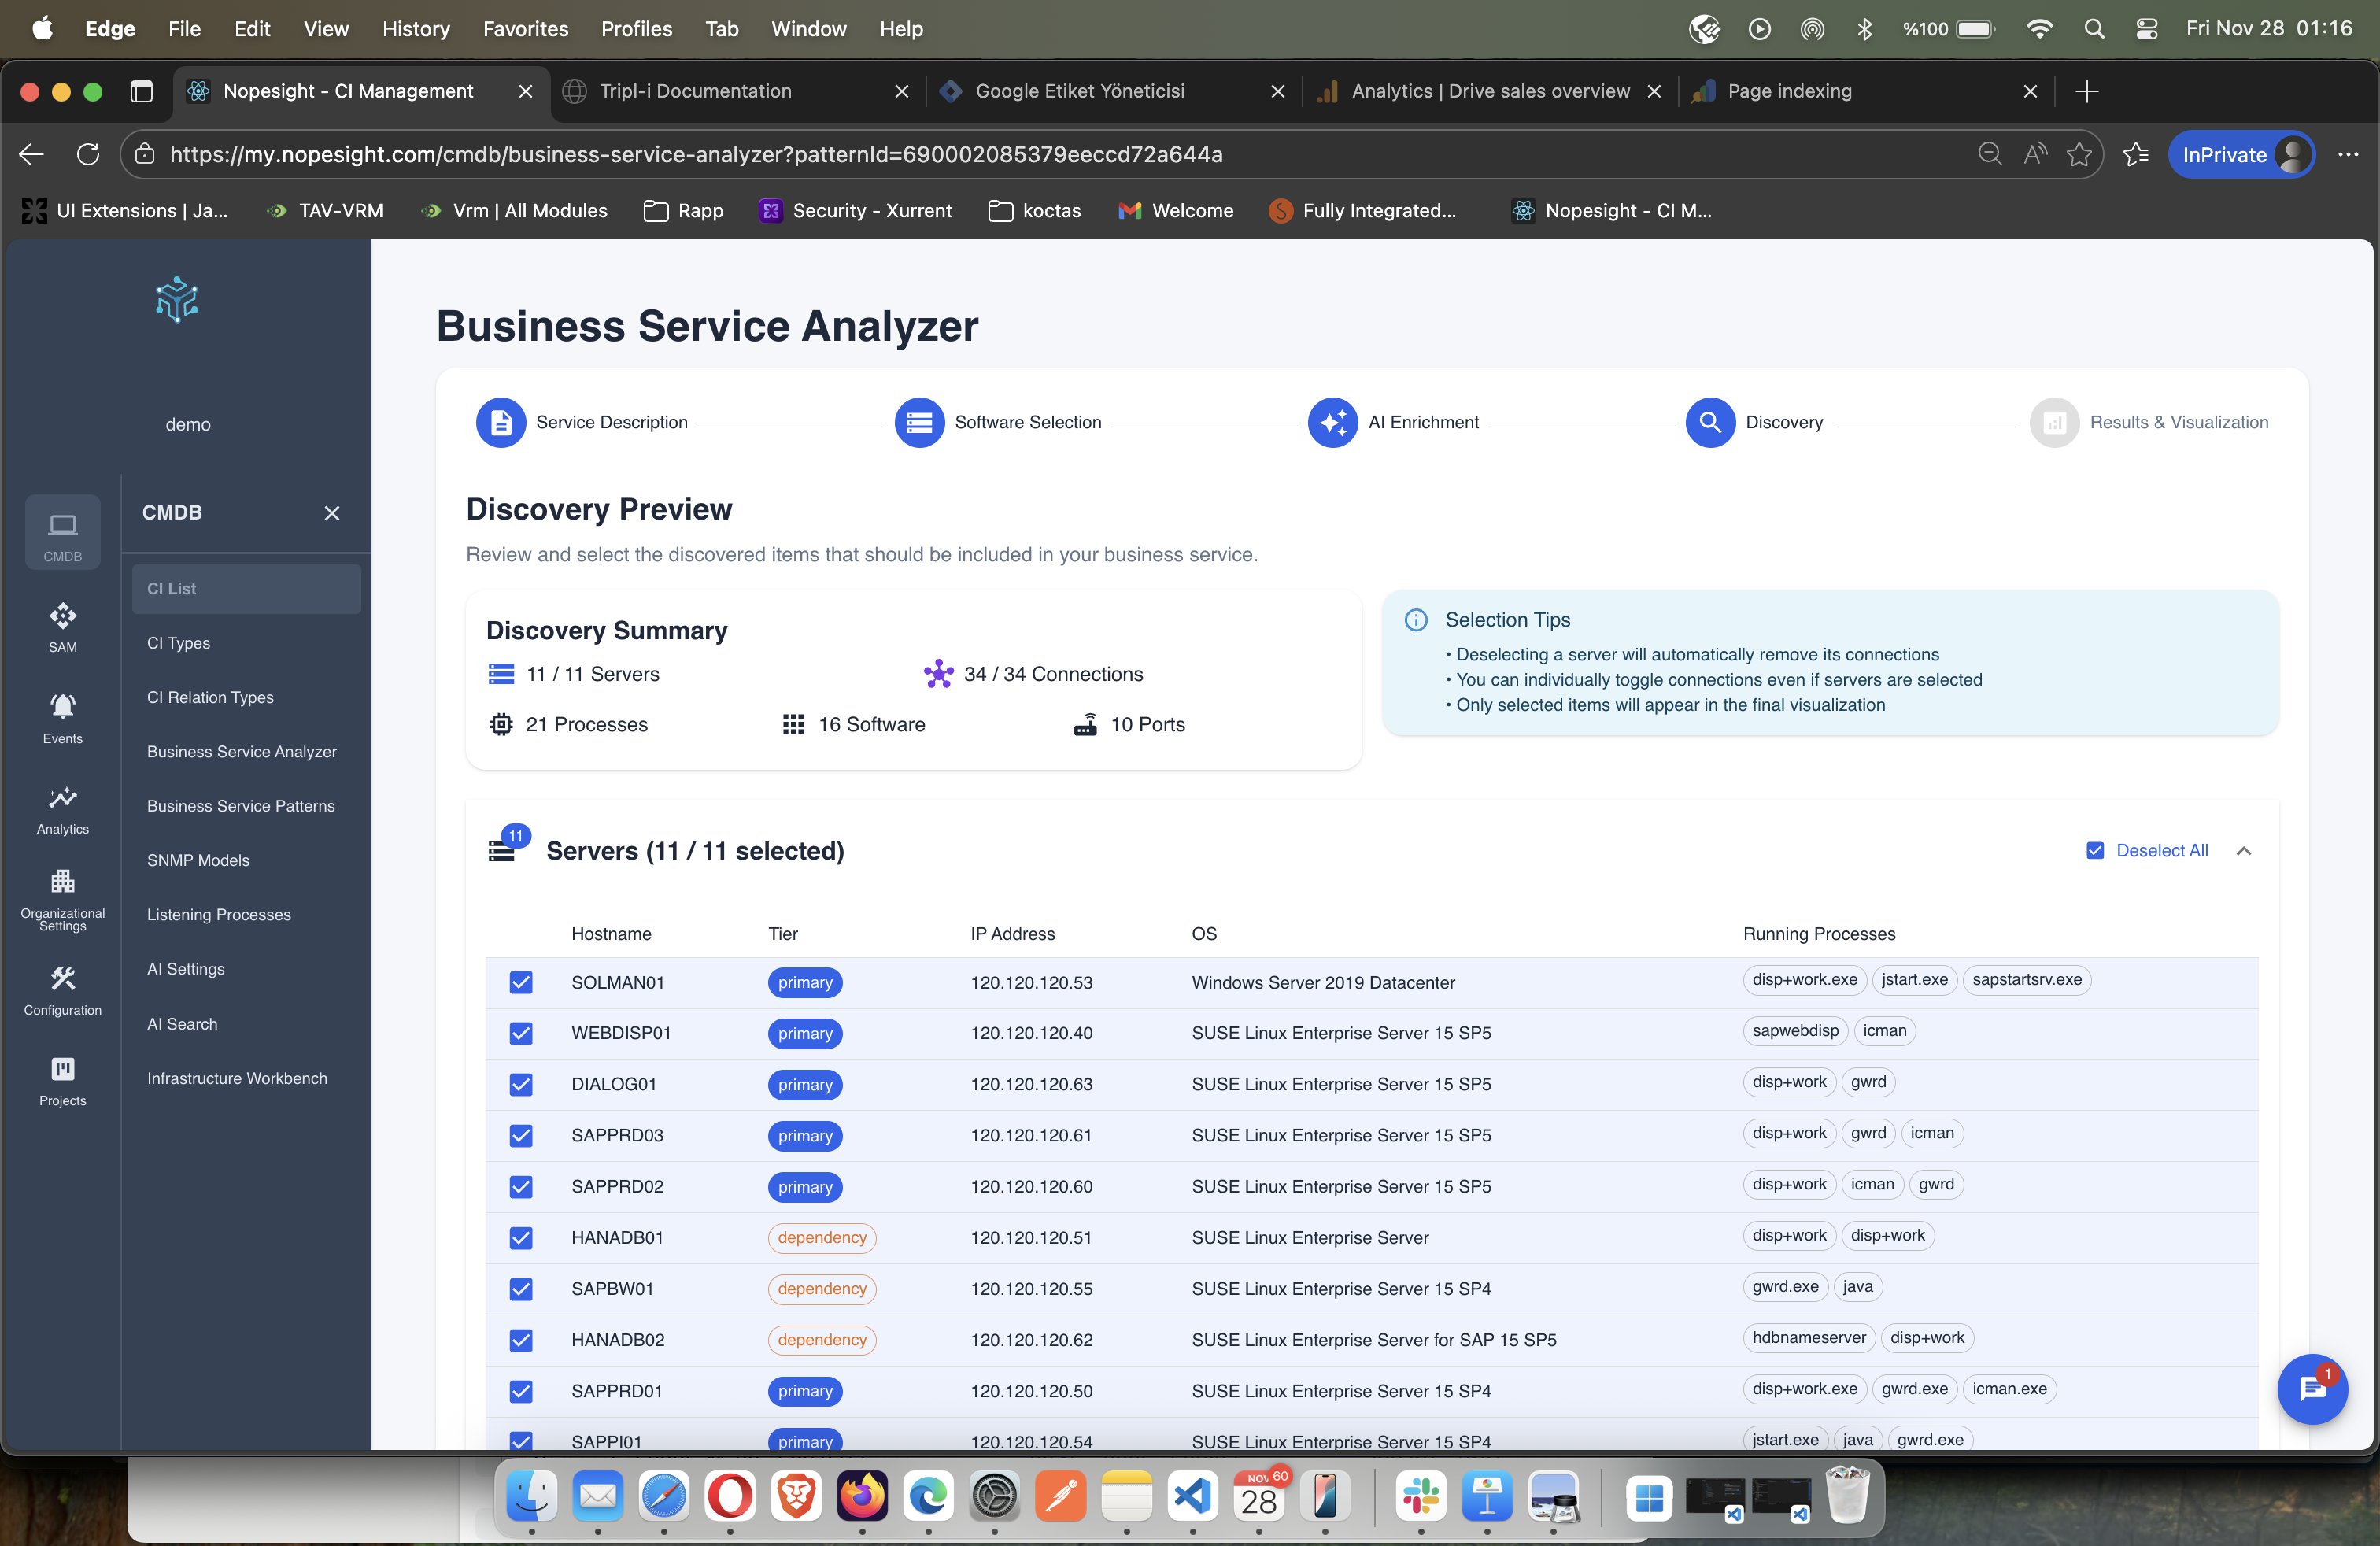
The discovery summary shows:
- Servers: Total discovered servers (e.g., 11/11 selected)
- Connections: Network relationships between servers (e.g., 34 connections)
- Processes: Running processes identified (e.g., 21 processes)
- Software: Installed applications (e.g., 16 software packages)
- Ports: Network ports in use (e.g., 10 ports)
Server Classification
Each discovered server is classified with:
| Column | Description |
|---|---|
| Hostname | Server name (e.g., SOLMAN01, WEBDISP01) |
| Tier | Primary (core service) or Dependency (supporting) |
| IP Address | Network address |
| OS | Operating system |
| Running Processes | Key processes running on this server |
Tier Badges:
- Primary (Blue): Core service components - the actual service servers
- Dependency (Orange): Supporting infrastructure connected to primary servers
Connection Mapping
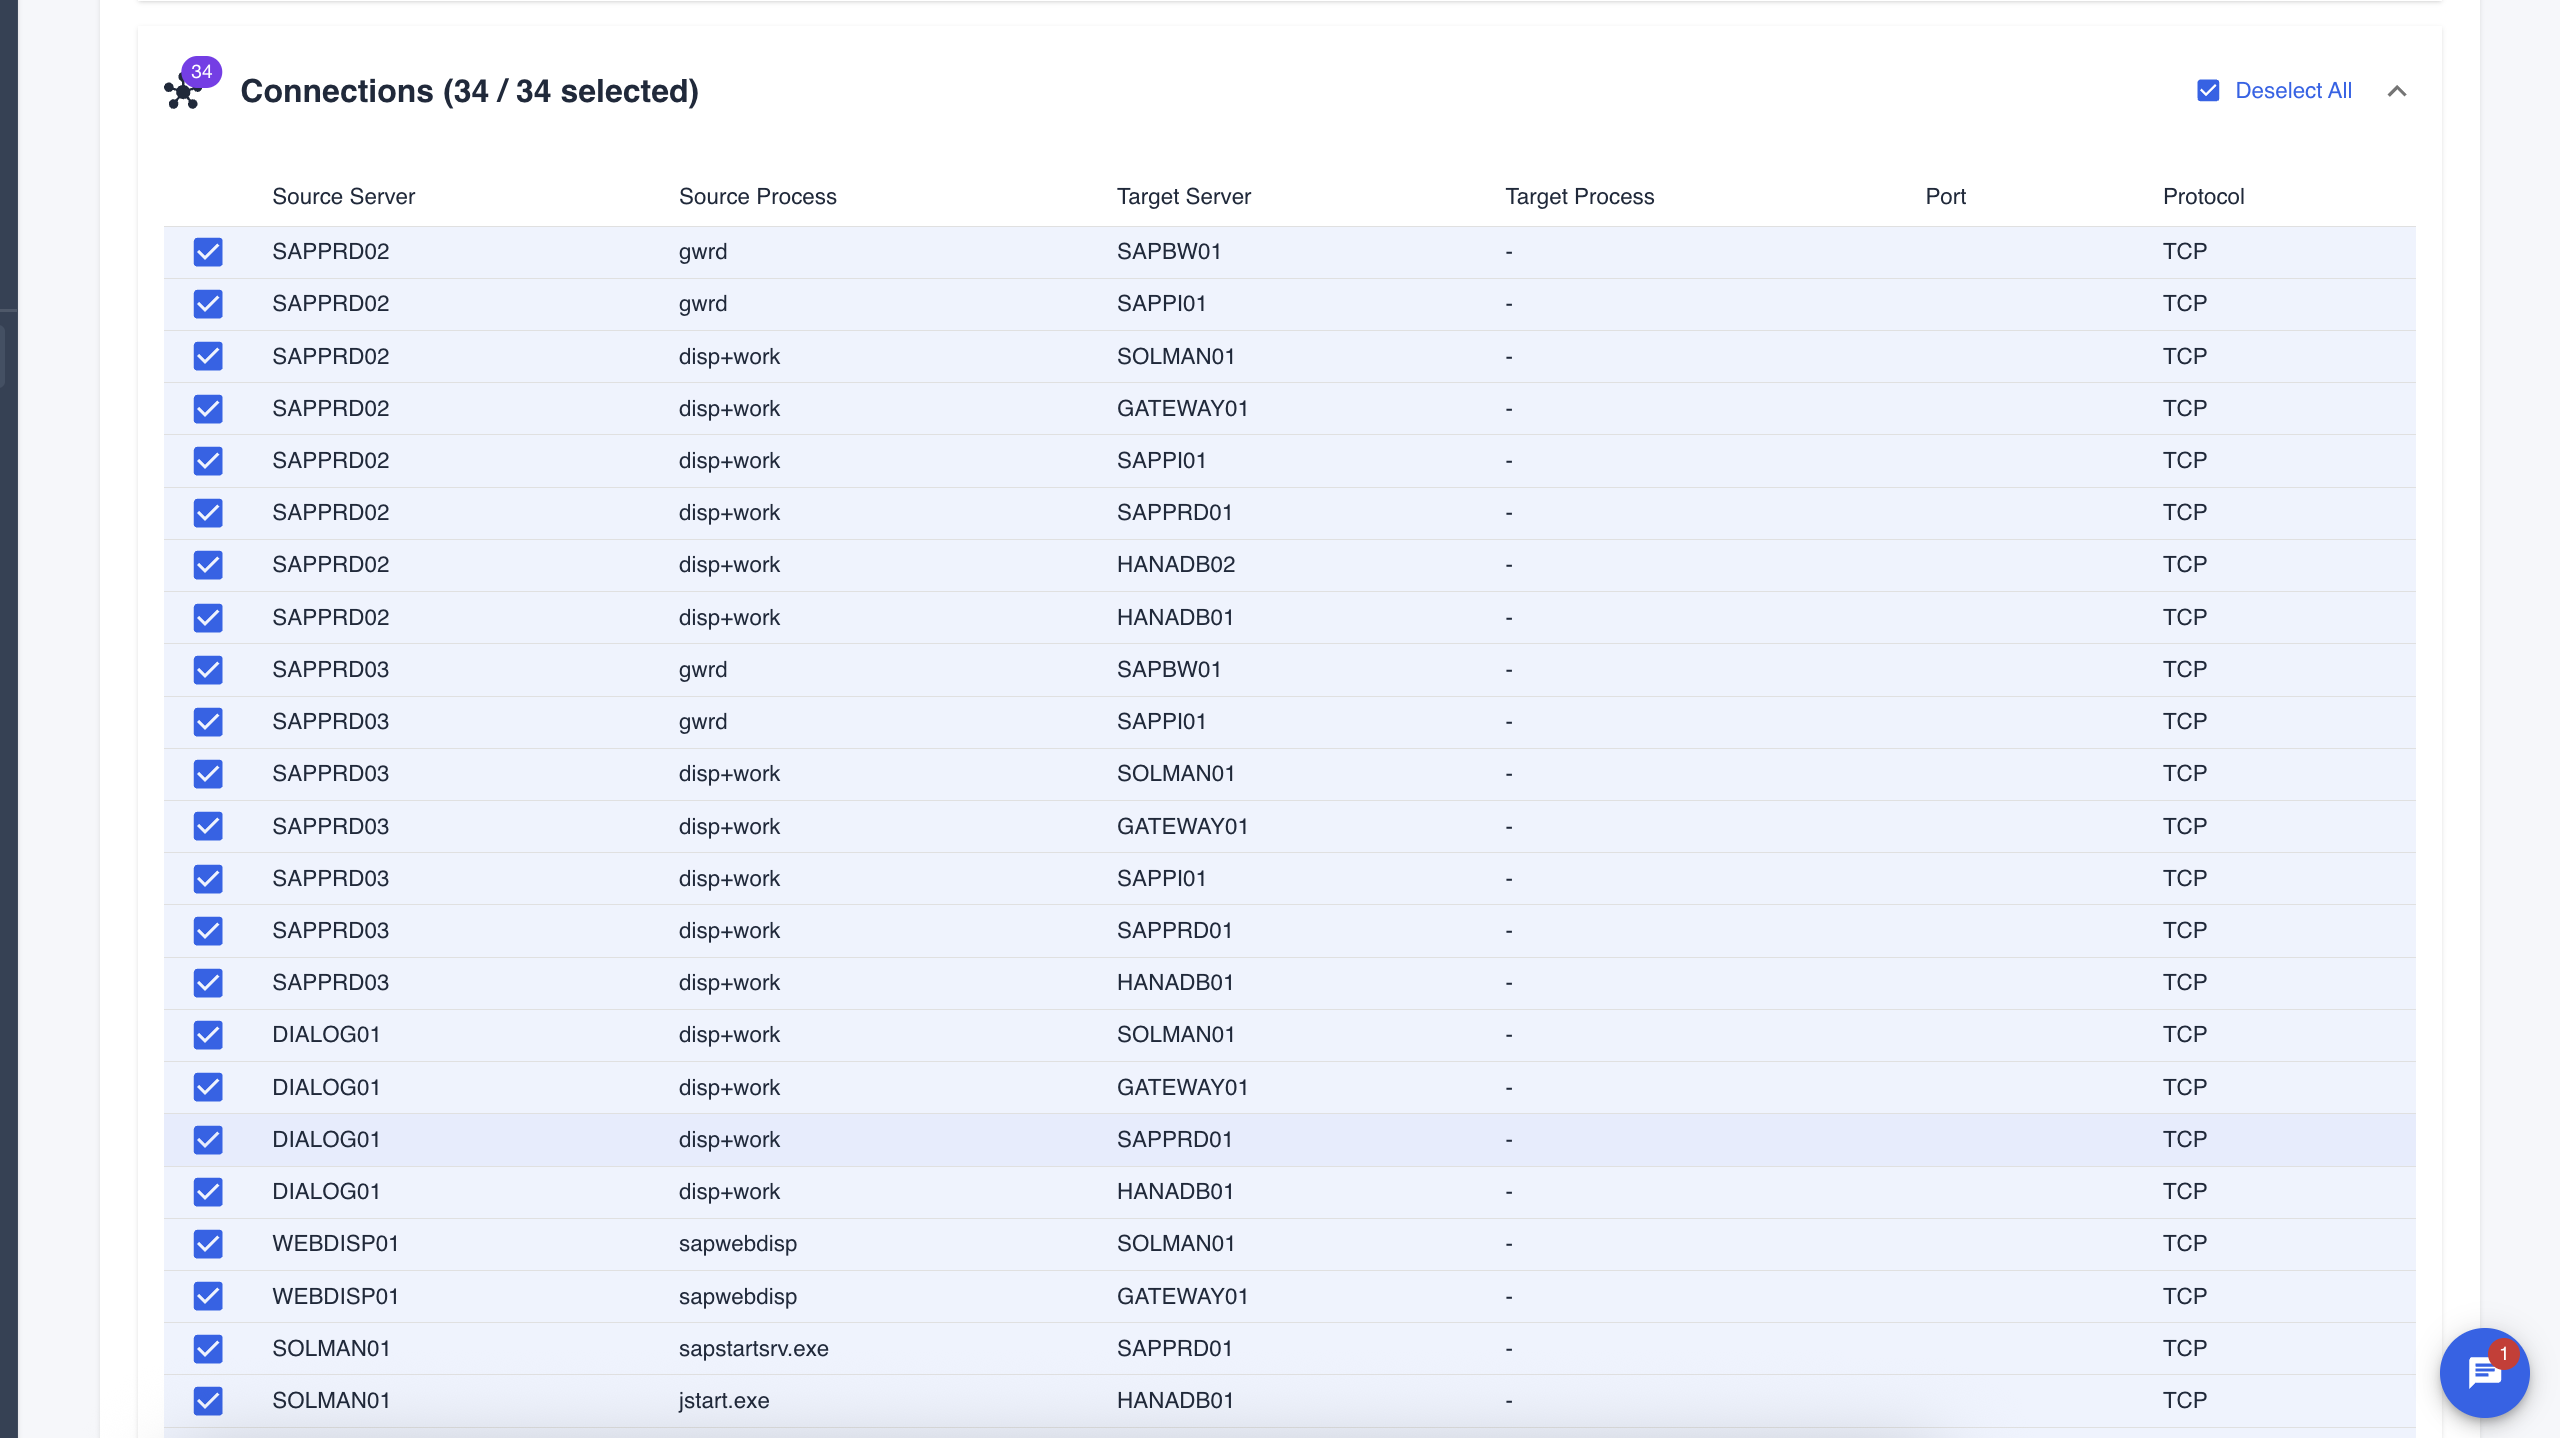
The connections table shows how servers communicate:
| Column | Description |
|---|---|
| Source Server | Server initiating the connection |
| Source Process | Process making the connection |
| Target Server | Destination server |
| Target Process | Target process (if known) |
| Port | Network port used |
| Protocol | TCP or UDP |
Selection Tips
The interface provides helpful selection guidance:
- Deselecting a server automatically removes its connections
- You can individually toggle connections even if servers are selected
- Only selected items will appear in the final visualization

Click "Continue with X servers and Y connections" to proceed to the results.
Discovery Results
After selecting your infrastructure, the system provides detailed analysis organized by tabs.
Servers Tab - Tier Classification
The Results view organizes servers into architectural tiers:
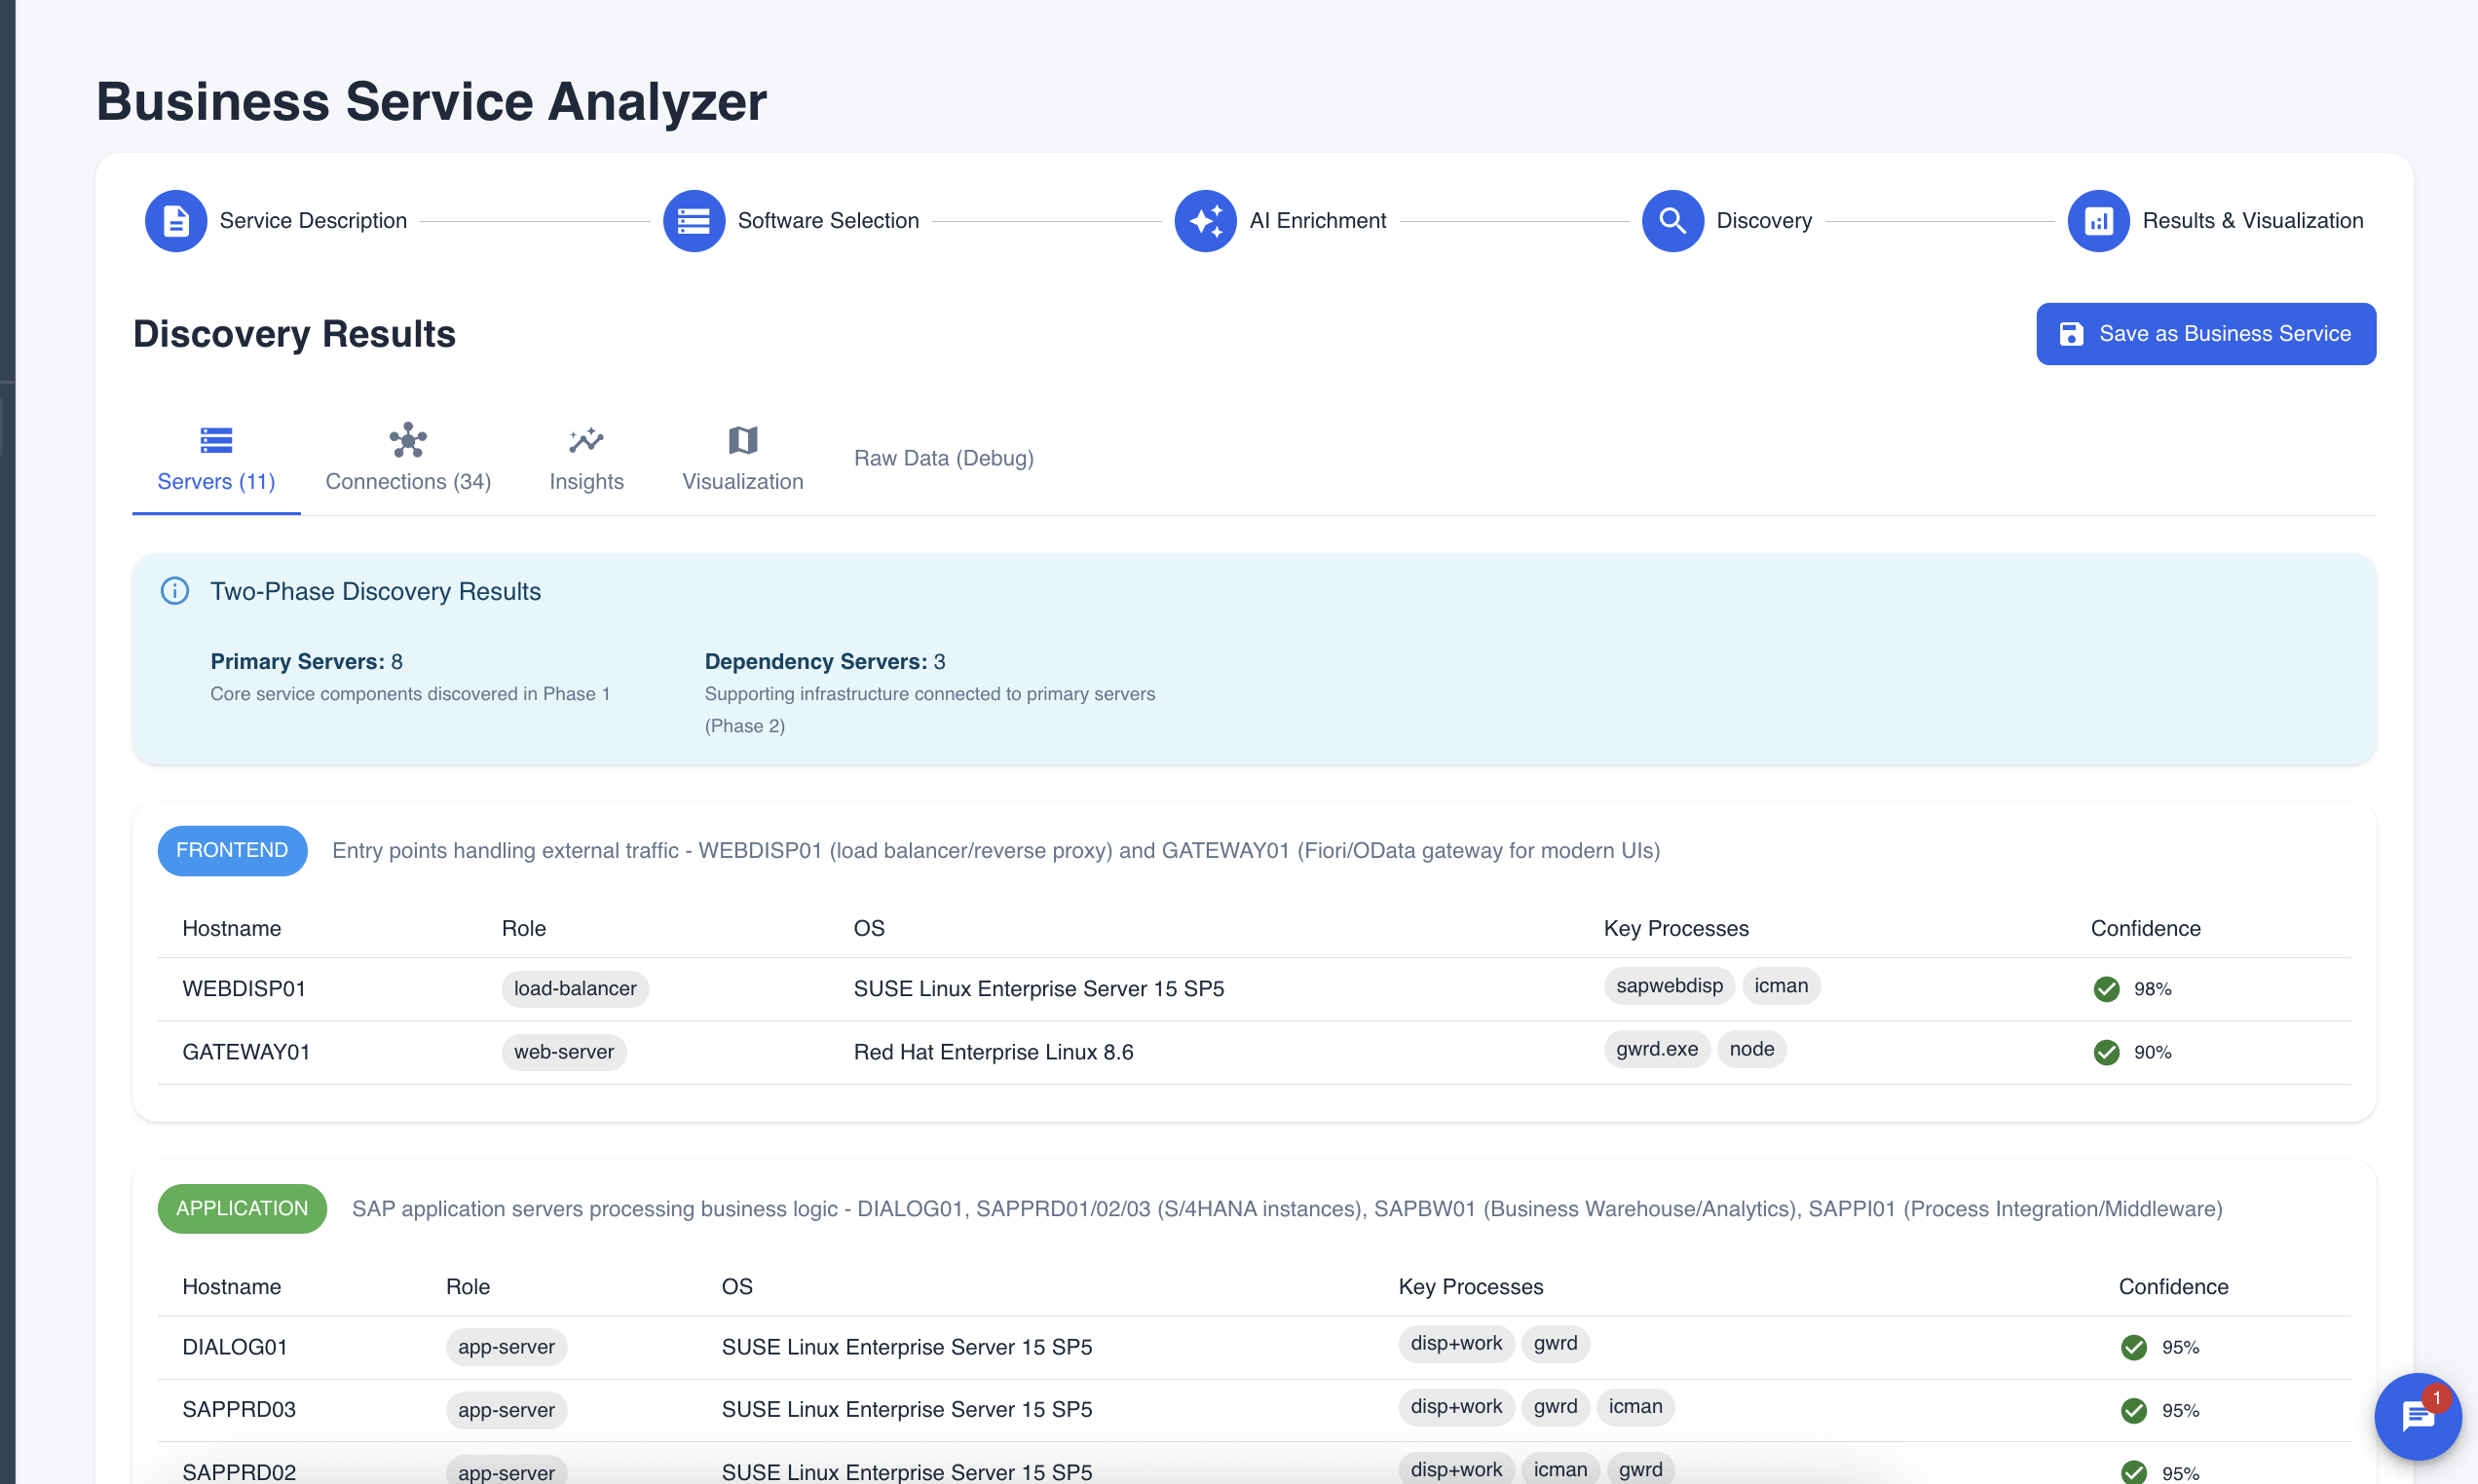
Two-Phase Discovery Results
At the top, you'll see the discovery breakdown:
- Primary Servers: Core service components discovered in Phase 1 (e.g., 8 servers)
- Dependency Servers: Supporting infrastructure connected to primary servers (e.g., 3 servers)
Tier Organization
Servers are grouped by their role in the architecture:
Frontend Tier (Blue badge) Entry points handling external traffic. Examples:
- WEBDISP01 - Load balancer/reverse proxy (sapwebdisp, icman processes)
- GATEWAY01 - Fiori/OData gateway for modern UIs (gwrd.exe, node processes)
Each server shows:
- Hostname: Server name
- Role: Functional classification (load-balancer, web-server, app-server, database)
- OS: Operating system
- Key Processes: Main processes running
- Confidence: AI confidence score for the classification
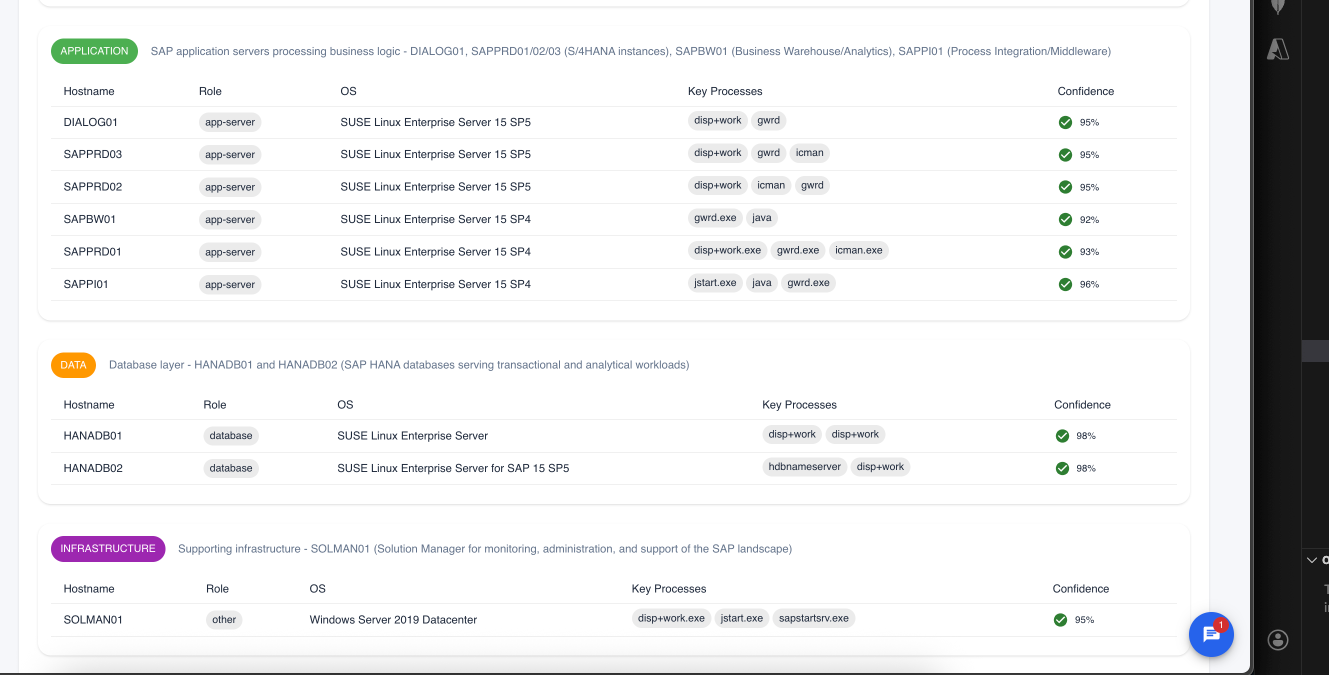
Application Tier (Green badge) Business logic processing servers:
- DIALOG01 - SAP dialog instance (disp+work, gwrd)
- SAPPRD01/02/03 - S/4HANA instances (disp+work, gwrd, icman)
- SAPBW01 - Business Warehouse/Analytics (gwrd.exe, java)
- SAPPI01 - Process Integration/Middleware (jstart.exe, java, gwrd.exe)
Data Tier (Orange badge) Database layer servers:
- HANADB01 - SAP HANA primary database (disp+work)
- HANADB02 - SAP HANA secondary/analytical (hdbnameserver, disp+work)
Infrastructure Tier (Purple badge) Supporting infrastructure:
- SOLMAN01 - Solution Manager for monitoring, administration, and support
Insights Tab
The Insights tab provides AI-generated analysis of your discovered service.
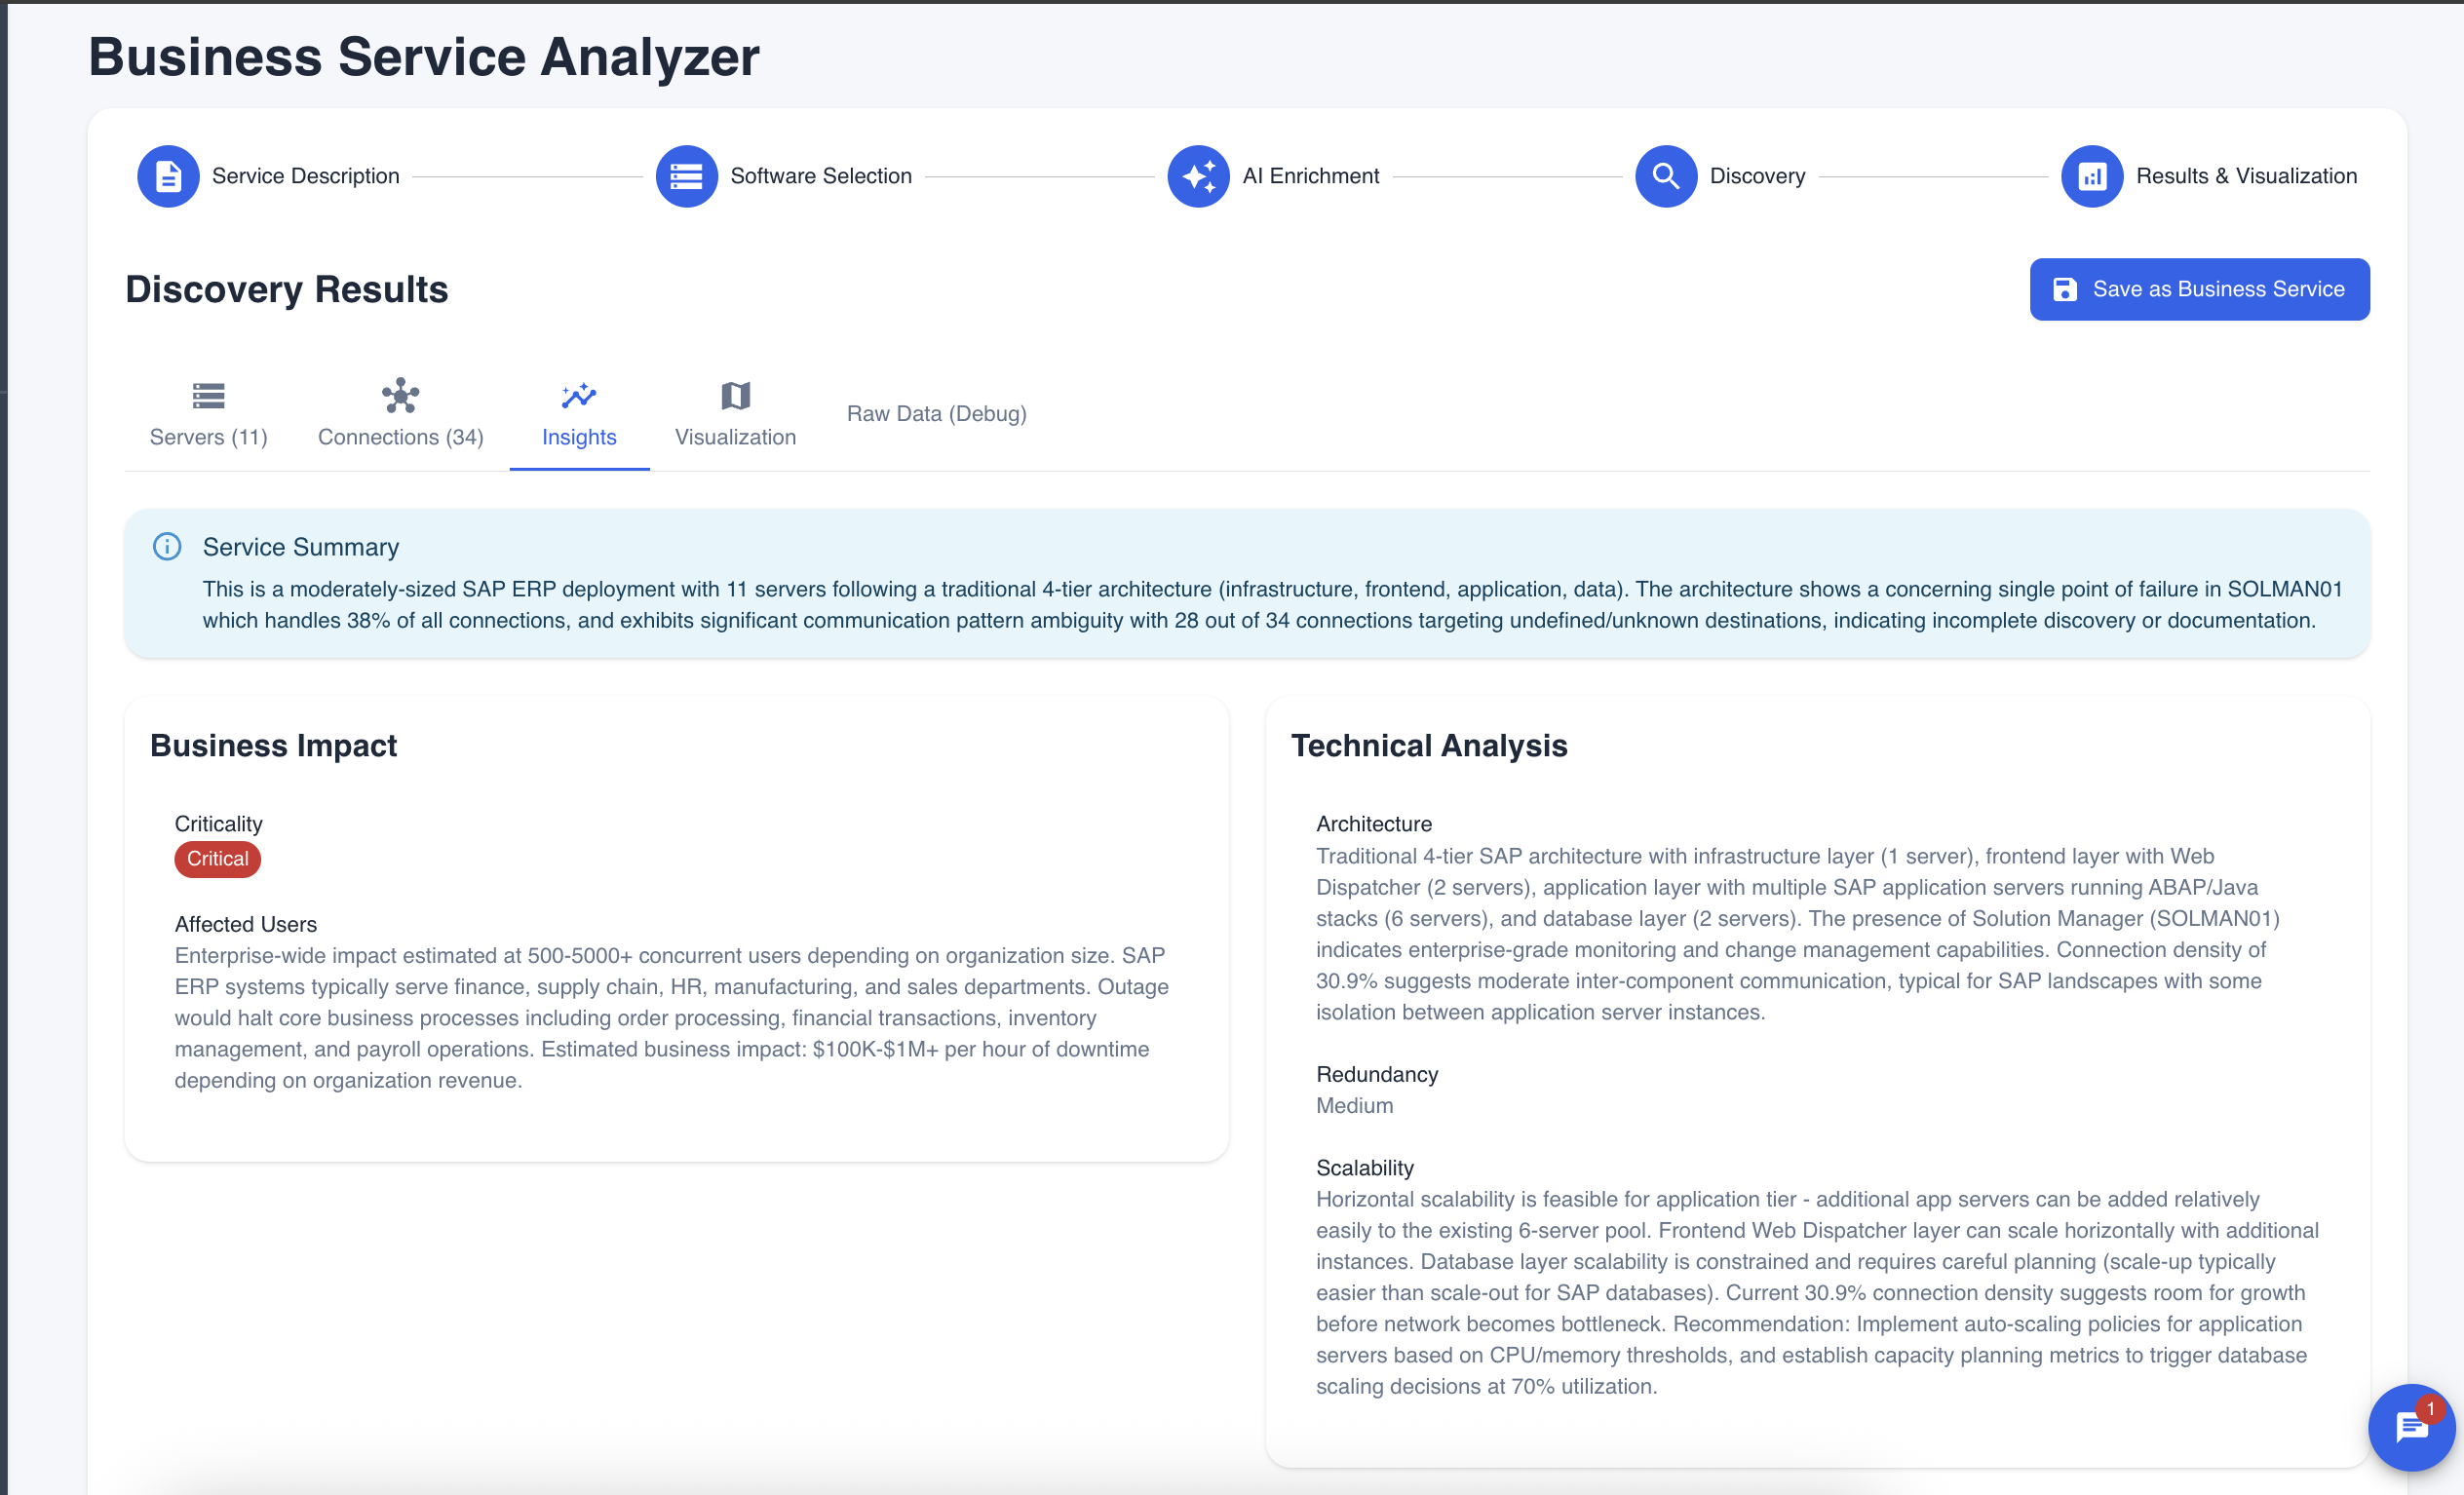
Service Summary
A high-level overview of the discovered service:
"This is a moderately-sized SAP ERP deployment with 11 servers following a traditional 4-tier architecture (infrastructure, frontend, application, data). The architecture shows a concerning single point of failure in SOLMAN01 which handles 38% of all connections..."
Business Impact
Assessment of the service's criticality:
- Criticality: Critical, High, Medium, or Low
- Affected Users: Estimated user impact (e.g., 500-5000+ concurrent users)
- Business Impact: Potential cost of outage (e.g., $100K-$1M+ per hour of downtime)
- Affected Departments: Finance, supply chain, HR, manufacturing, sales
Technical Analysis
Deep dive into the architecture:
- Architecture: Description of the tier structure and components
- Redundancy: Assessment of high-availability configuration (High, Medium, Low)
- Scalability: Analysis of scaling capabilities and recommendations
- Connection Density: Network traffic analysis between components
Recommendations
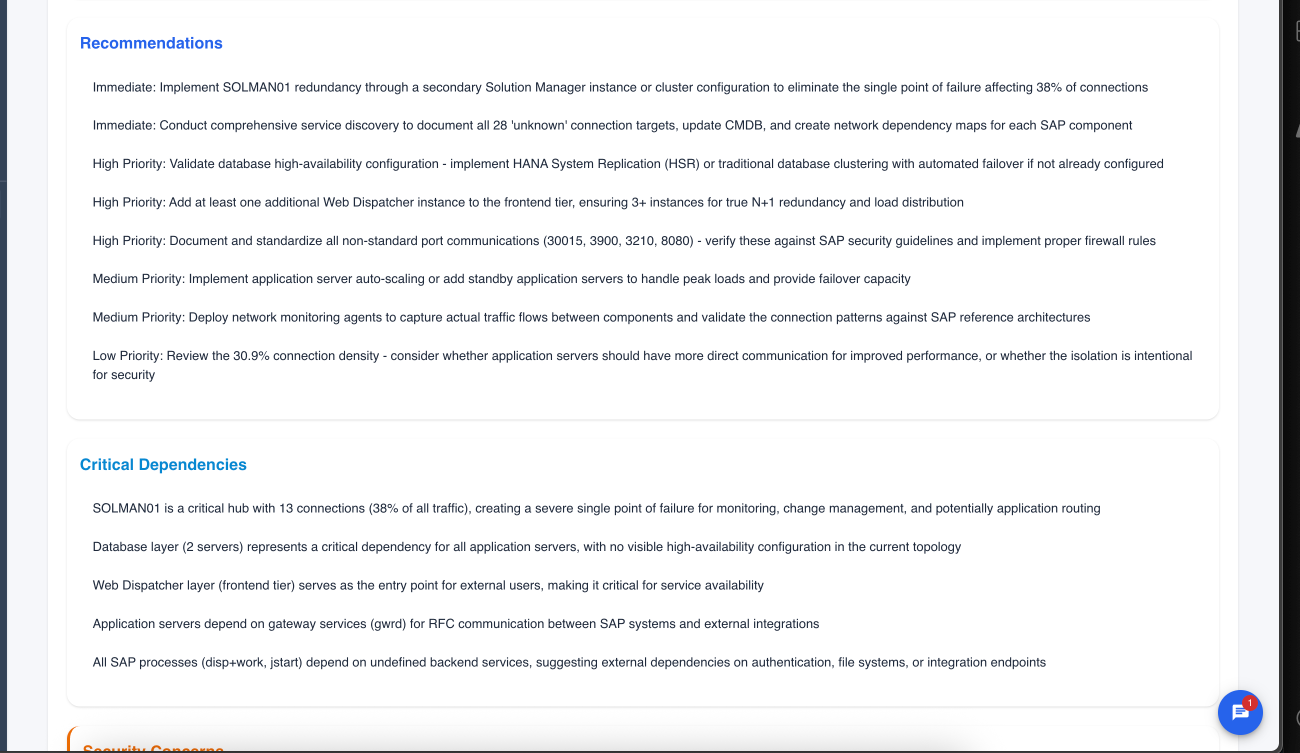
Prioritized action items:
Immediate Priority
- Implement redundancy for single points of failure
- Document unknown connections
High Priority
- Validate database high-availability configuration
- Add additional Web Dispatcher instances for frontend redundancy
- Document and standardize non-standard port communications
Medium Priority
- Implement application server auto-scaling
- Deploy network monitoring agents
- Review connection density optimization
Low Priority
- Evaluate direct application server communication patterns
Critical Dependencies
Identification of key dependencies:
- Single points of failure (e.g., "SOLMAN01 is a critical hub with 13 connections")
- Database layer dependencies
- Frontend tier requirements
- Gateway service dependencies
Security Concerns
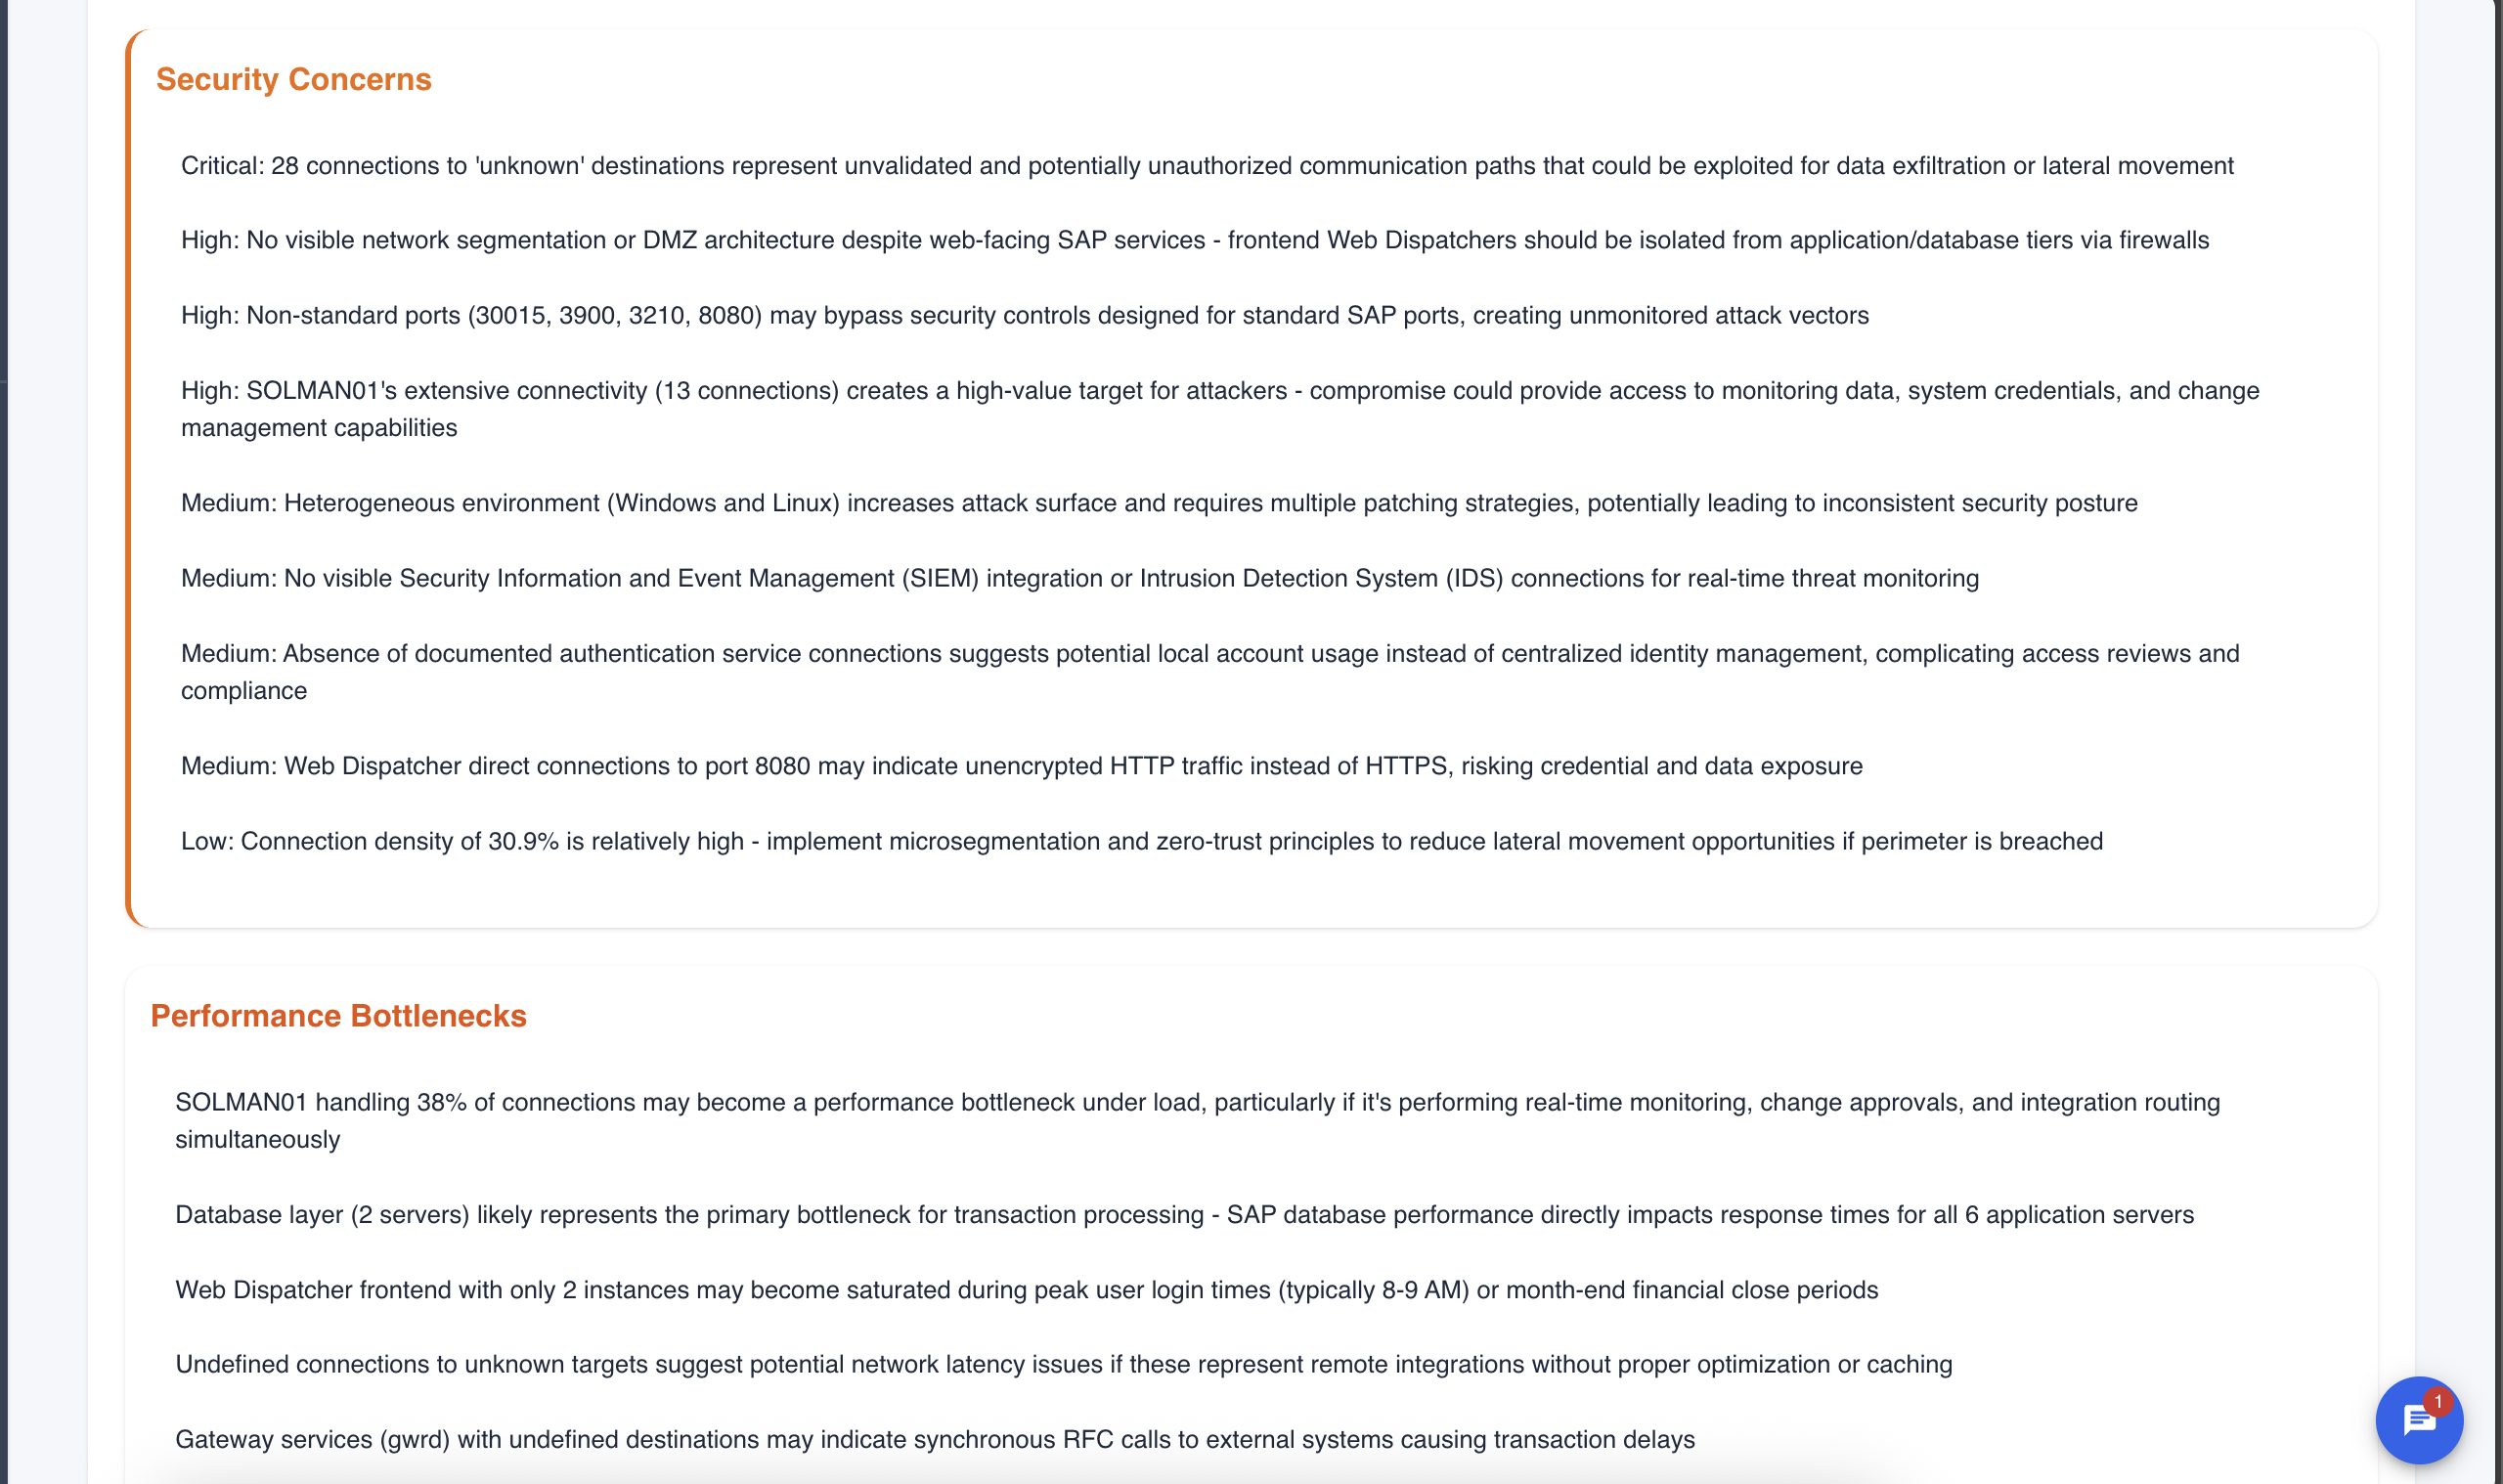
Security analysis with severity levels:
Critical
- Unknown/undocumented connection destinations
- Potentially unauthorized communication paths
High
- Missing network segmentation
- Non-standard port usage
- High-value target identification
Medium
- Heterogeneous environment patching challenges
- Missing SIEM/IDS integration
- Authentication service concerns
- Unencrypted HTTP traffic
Low
- Connection density and microsegmentation recommendations
Performance Bottlenecks
Identification of potential performance issues:
- Server load concentration (e.g., "SOLMAN01 handling 38% of connections")
- Database tier bottlenecks
- Frontend saturation during peak periods
- Undefined connection latency concerns
- Synchronous RFC call delays
Visualization Tab
The Visualization tab provides an interactive topology graph of your business service.
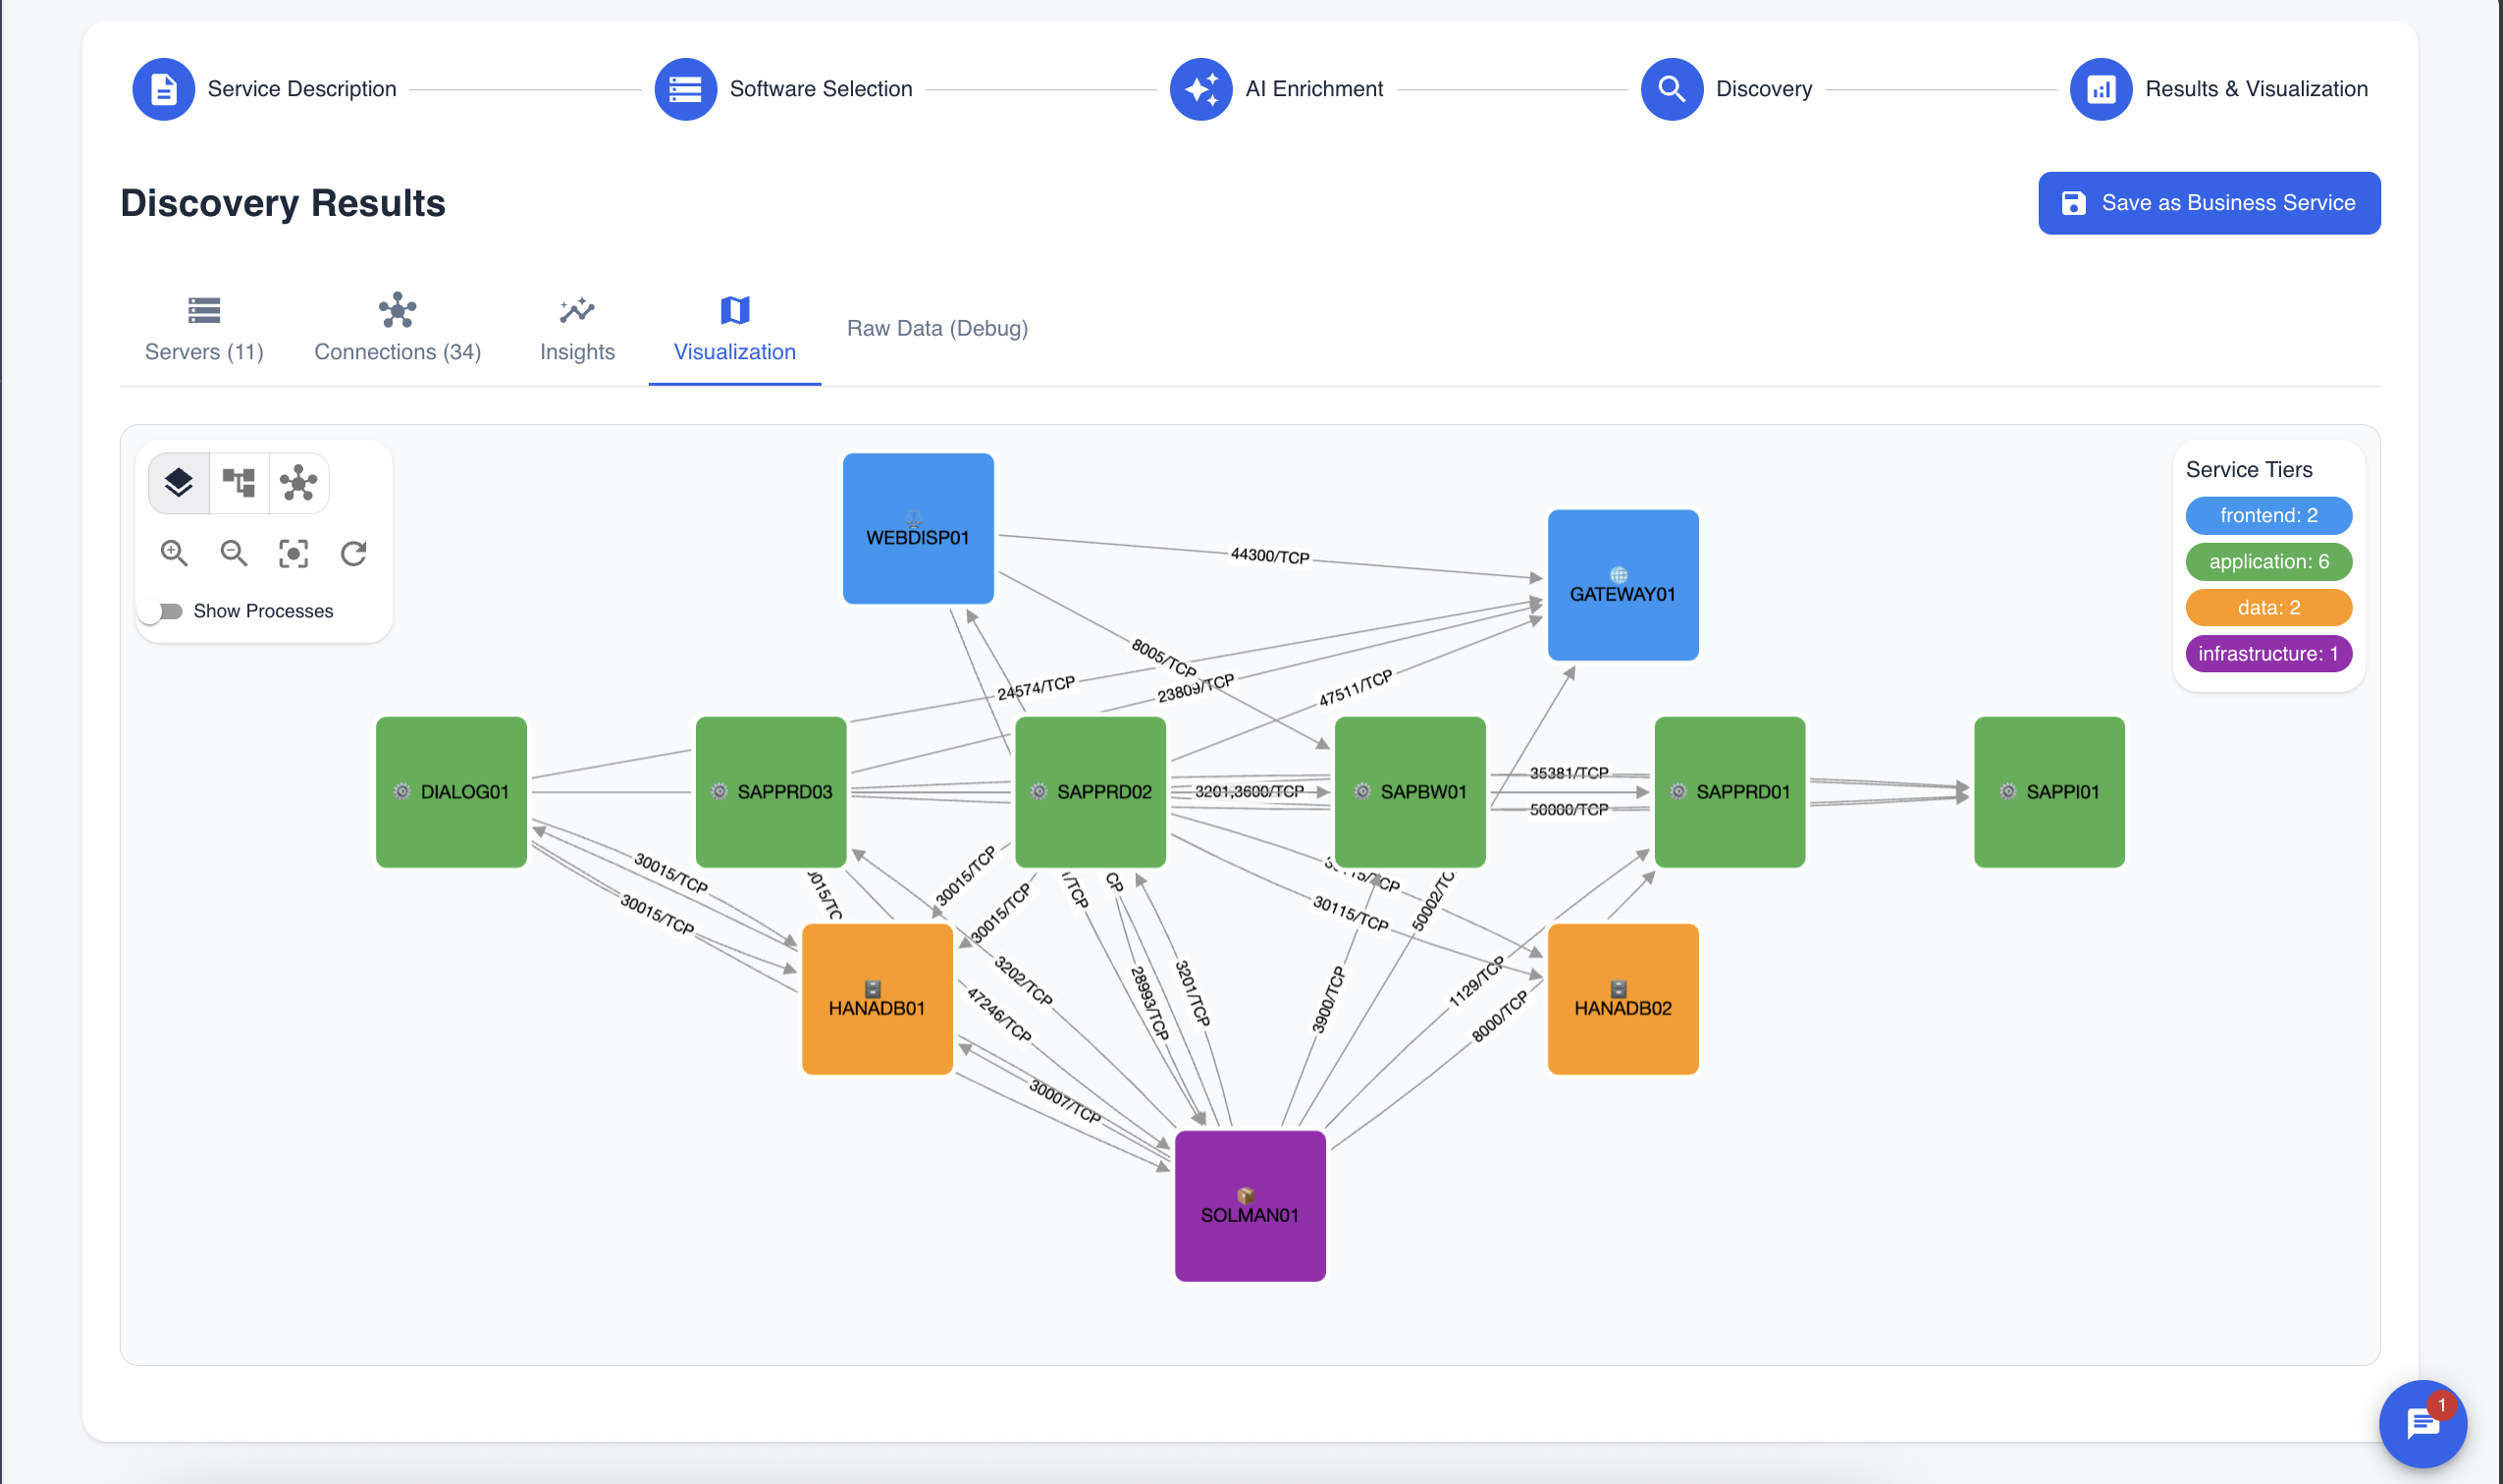
Understanding the Graph
Node Colors by Tier:
- Blue: Frontend tier (WEBDISP01, GATEWAY01)
- Green: Application tier (DIALOG01, SAPPRD01/02/03, SAPBW01, SAPPI01)
- Orange: Data tier (HANADB01, HANADB02)
- Purple: Infrastructure tier (SOLMAN01)
Connection Lines:
- Arrows show connection direction
- Labels show port numbers and protocols (e.g., 30015/TCP, 8005/TCP)
Legend: The Service Tiers panel on the right shows:
- frontend: 2 servers
- application: 6 servers
- data: 2 servers
- infrastructure: 1 server
Graph Controls
The toolbar provides:
- Layers: Toggle different views
- Fit: Fit graph to screen
- Auto-layout: Reorganize nodes
- Zoom: Zoom in/out
- Center: Center the graph
- Refresh: Reset the view
- Show Processes: Toggle process labels on connections
Interacting with the Graph
- Drag nodes to reposition them
- Click nodes to see server details
- Hover over connections to see connection details
- Use mouse wheel to zoom in/out
Saving the Business Service
Once satisfied with the discovery and analysis:
- Review all tabs (Servers, Connections, Insights, Visualization)
- Click "Save as Business Service" button
- The service is saved to your CMDB with:
- All discovered servers and their classifications
- Connection mappings
- AI-generated insights
- Topology visualization
The saved business service can be:
- Monitored for changes
- Used for impact analysis
- Referenced in change management
- Included in compliance reporting
Best Practices
Choosing the Right Pattern
- Use specific patterns for well-known services (SAP, Exchange, CyberArk)
- Start with patterns before trying manual entry
- Clone and customize patterns if the default doesn't match your environment
Reviewing Results
- Verify primary servers are correctly identified
- Check dependency servers for relevance
- Remove false positives by deselecting irrelevant items
- Review connections for accuracy
Using Insights
- Address Critical and High priority recommendations first
- Use security concerns for compliance documentation
- Share bottleneck analysis with operations teams
- Document the architecture using the visualization
Next Steps
After completing pattern-based discovery:
- Infrastructure Analysis - Discover unknown services across all infrastructure
- Exploring Servers - View individual server details and AI insights