Exploring a Server
This guide walks you through viewing a server in the CMDB, including its hardware details, installed applications, network connections, and AI-enriched relationships.
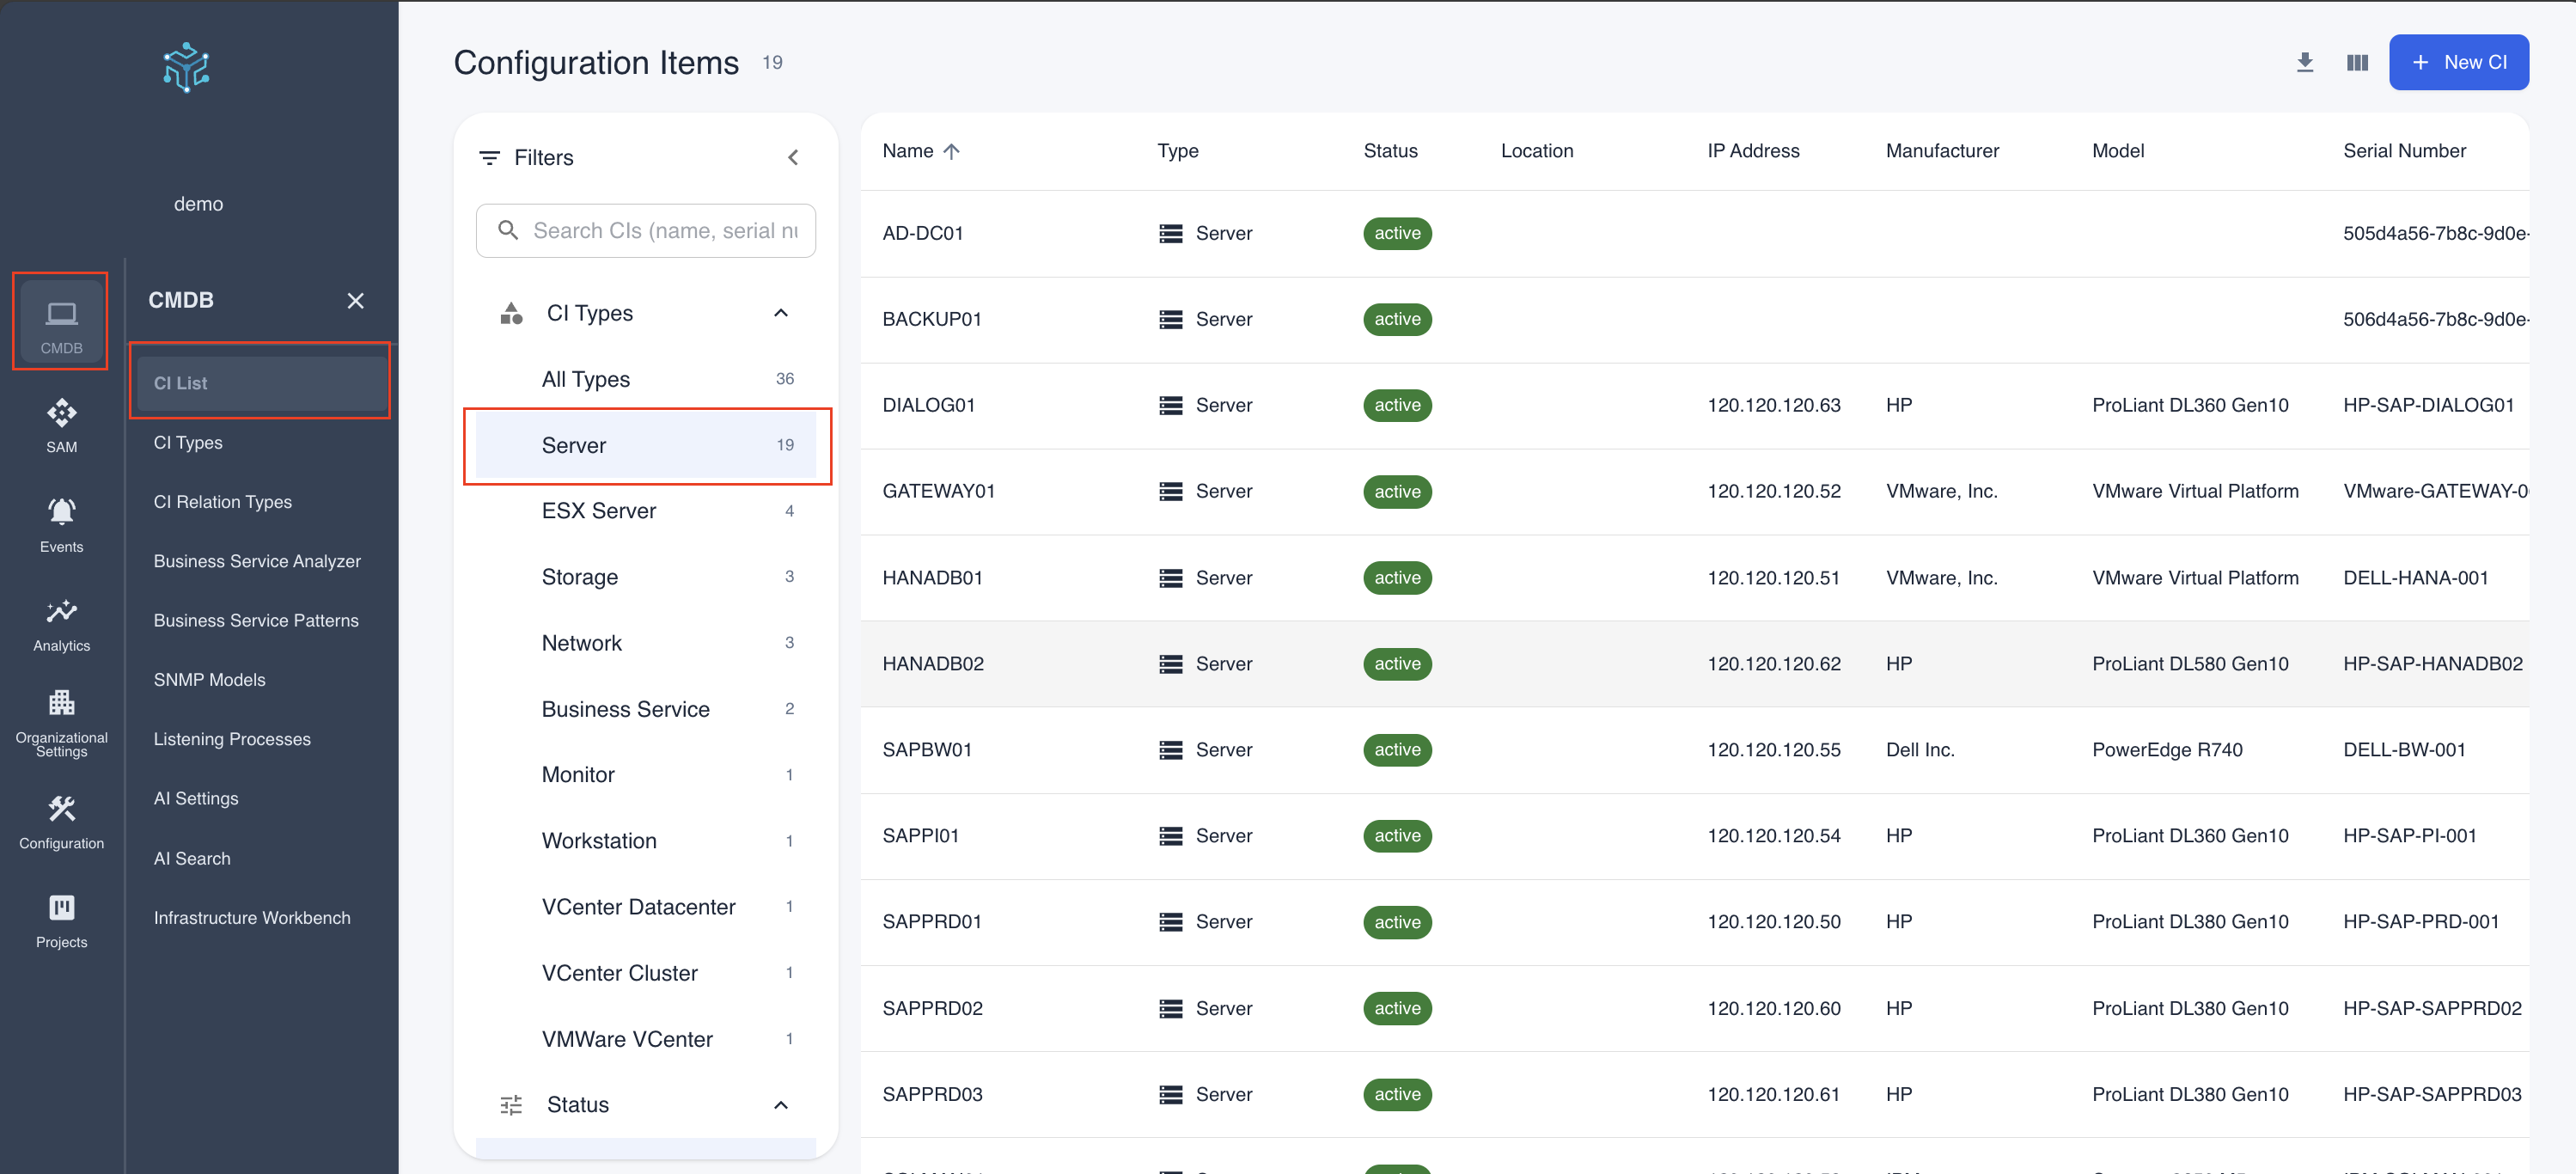
Filtering to Servers
- Navigate to CMDB > CI List
- In the filter sidebar, click on CI Types to expand it
- Click on Server to filter the list
The table now shows only server CIs. In the demo environment, you'll see various servers including SAP HANA database servers, application servers, and infrastructure servers.
Opening Server Details
Click on HANADB01 to open its detail page. This is an SAP HANA database server running on VMware.
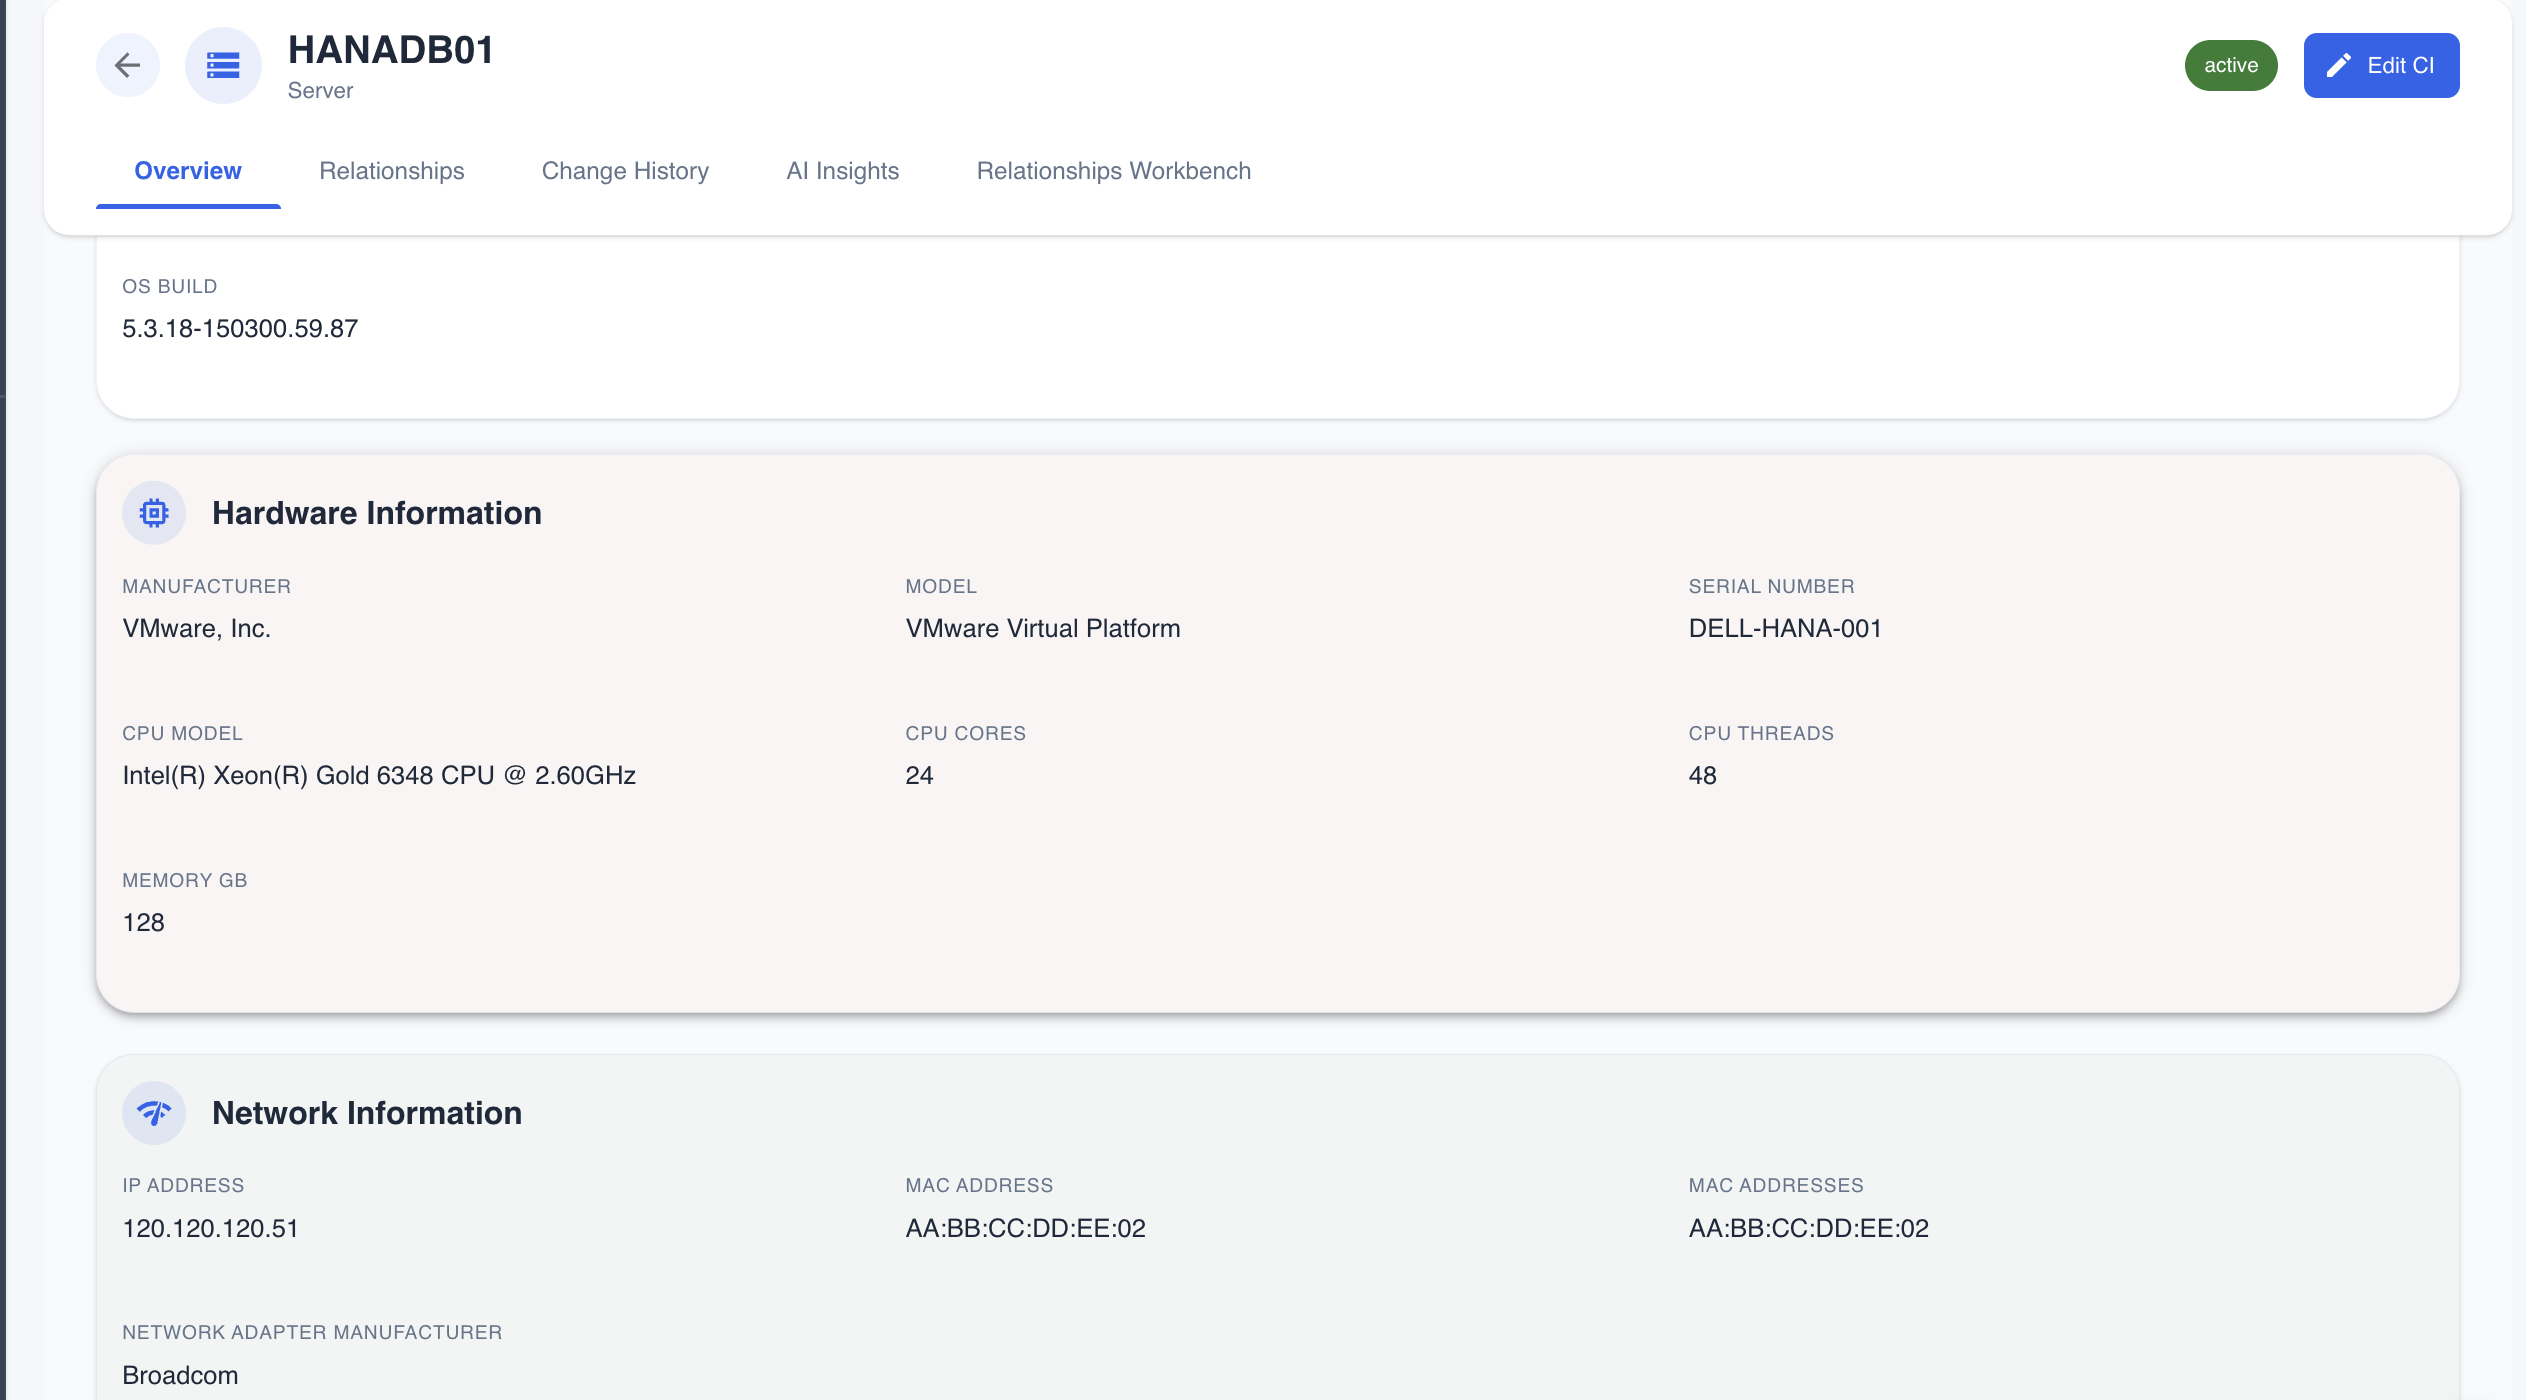
Server Overview
The server detail page shows comprehensive information:
Hardware Information
- Manufacturer - VMware, Inc.
- Model - VMware Virtual Platform
- Serial Number - DELL-HANA-001
- CPU Model - Intel(R) Xeon(R) Gold 6348 CPU @ 2.60GHz
- CPU Cores - 24 physical cores
- CPU Threads - 48 logical threads
- Memory GB - 128 GB RAM
Network Information
- IP Address - 120.120.120.51
- MAC Address - Network adapter hardware addresses
- Network Adapter Manufacturer - Broadcom
Collections for Servers
Servers have additional collections compared to workstations, providing deeper visibility into running applications and network activity.
Network Connections
Click on the Network Connections tab to see active network connections from the server.

This shows:
- Protocol - TCP/UDP
- Local Address - Server's IP address
- Local Port - Port the server is listening on
- Remote Address - Connected remote IP
- Remote Port - Remote port
- State - Connection state (ESTABLISHED, LISTENING, etc.)
- PID - Process ID
- Process Name - The process handling the connection (e.g.,
hdbindexserver,hdbwebdispatcher)
Installed Applications
Click on the Installed Applications tab to see the software inventory.

For each application, you can see:
- Name - Application name (e.g., SAP HANA Database, SAP Host Agent, SAP HANA Client)
- Vendor - Software vendor (e.g., SAP SE)
- Version - Installed version number
- Install Date - When the software was installed
- Install Location - File system path (e.g.,
/usr/sap/HDB) - CPE Name - Common Platform Enumeration identifier for vulnerability matching
- Software Instance CI Id - Link to the software instance in the CMDB
Other Server Collections
Servers also include:
- Disks - Physical and logical storage
- User Accounts - Local and domain accounts
- Network Adapters - Network interface configuration
- Physical Disks - Hardware storage devices
- Events - System events and logs
- Connected Monitors - Display devices (if applicable)
- Peripheral Devices - Connected hardware
Relationships Tab
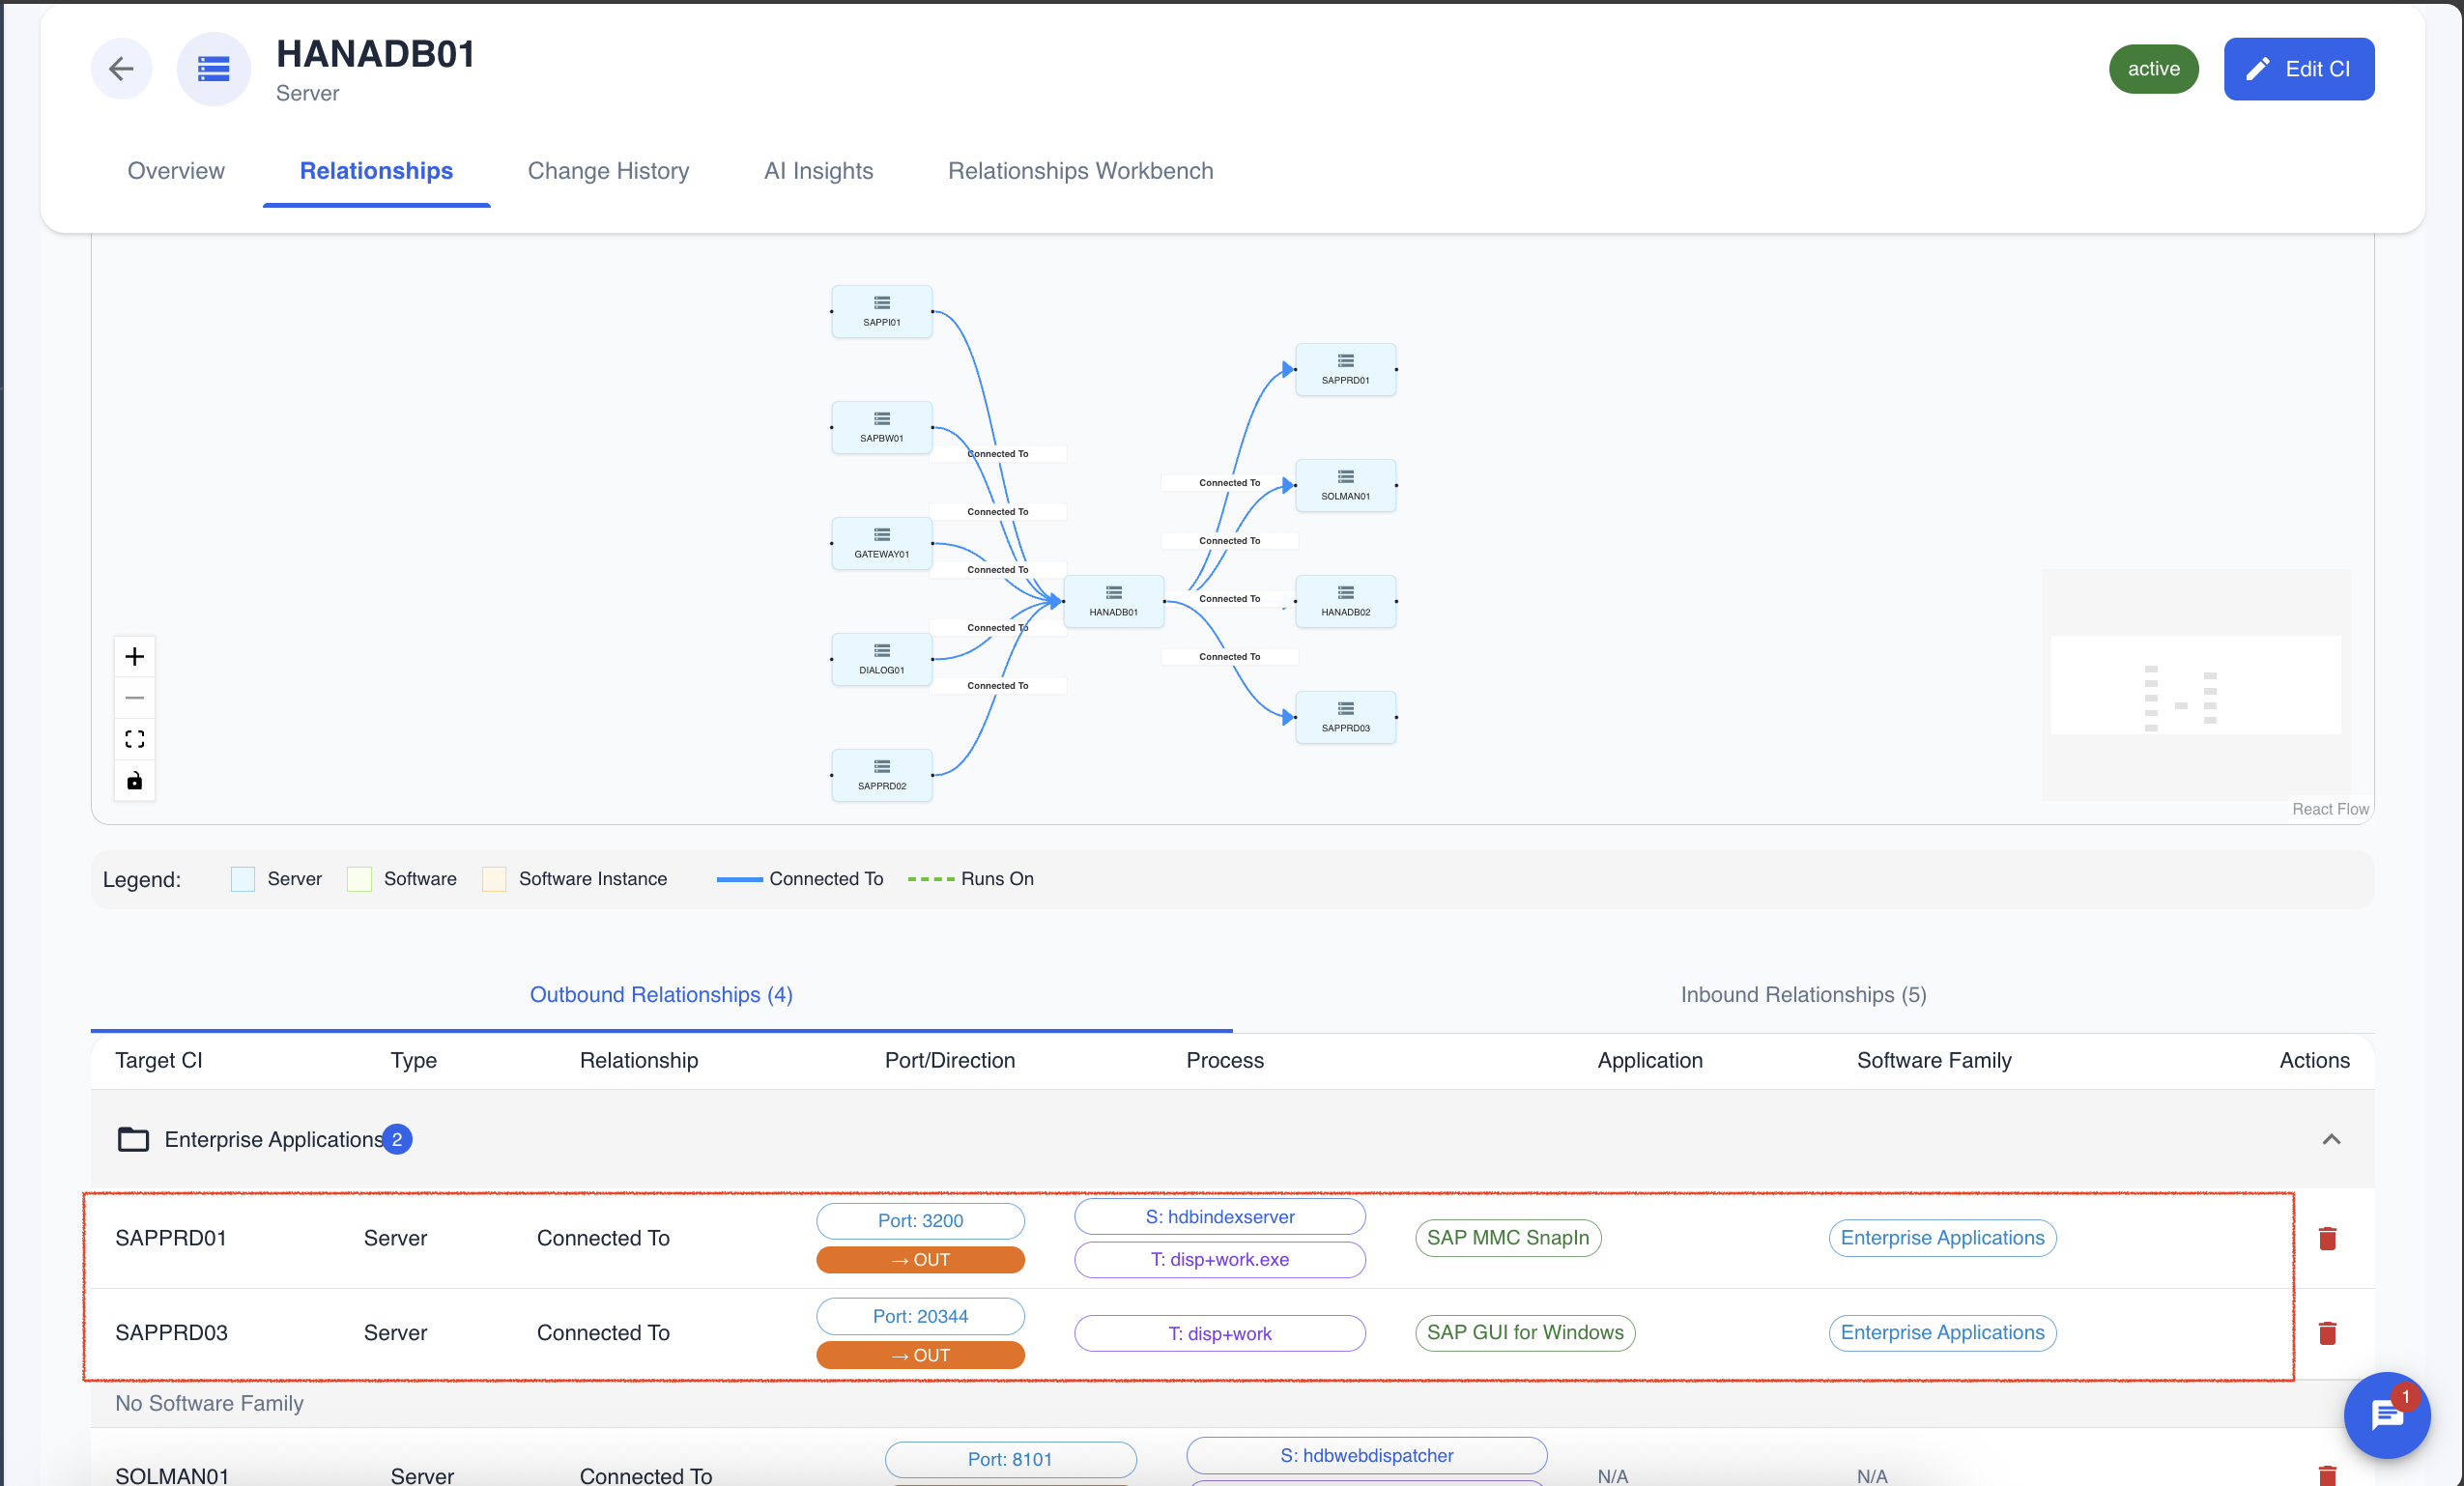
Click on the Relationships tab to see how this server connects to other infrastructure components.
How Relationships Are Discovered
Tripl-i automatically discovers relationships by analyzing network connection data collected during discovery scans. When the scanner agent runs on a server, it captures:
- Active TCP/UDP connections - All network connections the server has established
- Listening ports - Services the server is hosting
- Process information - Which application/process owns each connection
The system then correlates this data across all scanned servers to build a complete picture of how your infrastructure communicates.
Understanding Inbound vs Outbound
Relationships are categorized by direction based on which server initiated the connection:
Outbound Relationships
Connections where this server is the client - it initiated the connection to another server.
Example: HANADB01 connects TO SAPPRD01 on port 3200
- HANADB01 is using an ephemeral port (high-numbered, temporary)
- SAPPRD01 is listening on port 3200 (SAP application server port)
- Direction: Outbound from HANADB01's perspective
Inbound Relationships
Connections where this server is the server - another system connected to it.
Example: SAPBW01 connects TO HANADB01 on port 30015
- SAPBW01 initiated the connection
- HANADB01 is listening on port 30015 (HANA database port)
- Direction: Inbound to HANADB01
How Direction Is Determined
Tripl-i uses multiple signals to accurately determine connection direction:
- Listening Services - If a port is registered as a listening service, traffic to that port is inbound
- Connection State - LISTEN state indicates a server port
- Well-Known Ports - Standard service ports (22, 80, 443, 1433, 3306, etc.) indicate the server side
- Ephemeral Ports - High ports (49152+) typically indicate the client side
- Port Range Analysis - Lower ports are usually services, higher ports are clients
Understanding the Relationship Table Columns
| Column | Description |
|---|---|
| Target CI | The server or device on the other end of the connection |
| Type | CI type of the target (Server, Software Instance, etc.) |
| Relationship | The relationship type (Connected To, Runs On, Depends On) |
| Port/Direction | The service port and connection direction (IN/OUT) |
| Process | The process(es) handling this connection on source (S:) and target (T:) |
| Application | AI-identified application responsible for this connection |
| Software Family | AI-classified category (Enterprise Applications, Database, etc.) |
Understanding Port and Process Information
Port Information
- Port: 3200 - The well-known service port being used
- L:30013 → R:50001 - Local port to Remote port (shown for detailed connections)
- → OUT - Orange badge indicating outbound connection
- ← IN - Green badge indicating inbound connection
Process Information
- S: hdbindexserver - Source process (the process on the source CI)
- T: disp+work.exe - Target process (the process on the target CI)
The process names help you understand which application component is communicating. For example:
hdbindexserver- SAP HANA database index server processhdbwebdispatcher- SAP HANA web dispatcher processdisp+work.exe- SAP application server dispatcher process
Visual Dependency Map
The top section shows an interactive diagram of the server's relationships:
- Server nodes - Connected servers (SAPPI01, SAPBW01, GATEWAY01, etc.)
- Connection lines - "Connected To" relationships with arrows showing direction
- Legend - Server, Software, Software Instance types
- Zoom controls - Zoom in/out and fit to screen
AI-Enriched Relationship Data
Tripl-i uses AI to automatically enrich relationship data with business context:
Application Identification
AI analyzes the combination of:
- Process names
- Port numbers
- Known software patterns
- Installed application data
To identify which application is responsible for each connection. For example, a connection on port 3200 from process disp+work.exe is identified as SAP GUI for Windows.
Software Family Classification
Applications are automatically categorized into software families:
- Enterprise Applications - SAP, Oracle EBS, Microsoft Dynamics
- Database - SQL Server, Oracle, PostgreSQL, HANA
- Monitoring - Nagios, Zabbix, SCOM
- Web Services - IIS, Apache, Nginx
- Infrastructure - Active Directory, DNS, DHCP
Grouping by Family
In the relationship table, connections are grouped by software family using expandable accordion sections. This makes it easy to:
- See all database connections together
- Identify all enterprise application dependencies
- Find monitoring system relationships
Why This Matters
Understanding relationships helps you:
- Impact Analysis - Before making changes, see what depends on this server
- Troubleshooting - Trace connection issues across the infrastructure
- Change Management - Plan maintenance windows knowing all affected systems
- Security Analysis - Understand network communication patterns
- Documentation - Automatically maintain up-to-date dependency documentation
AI Relations View
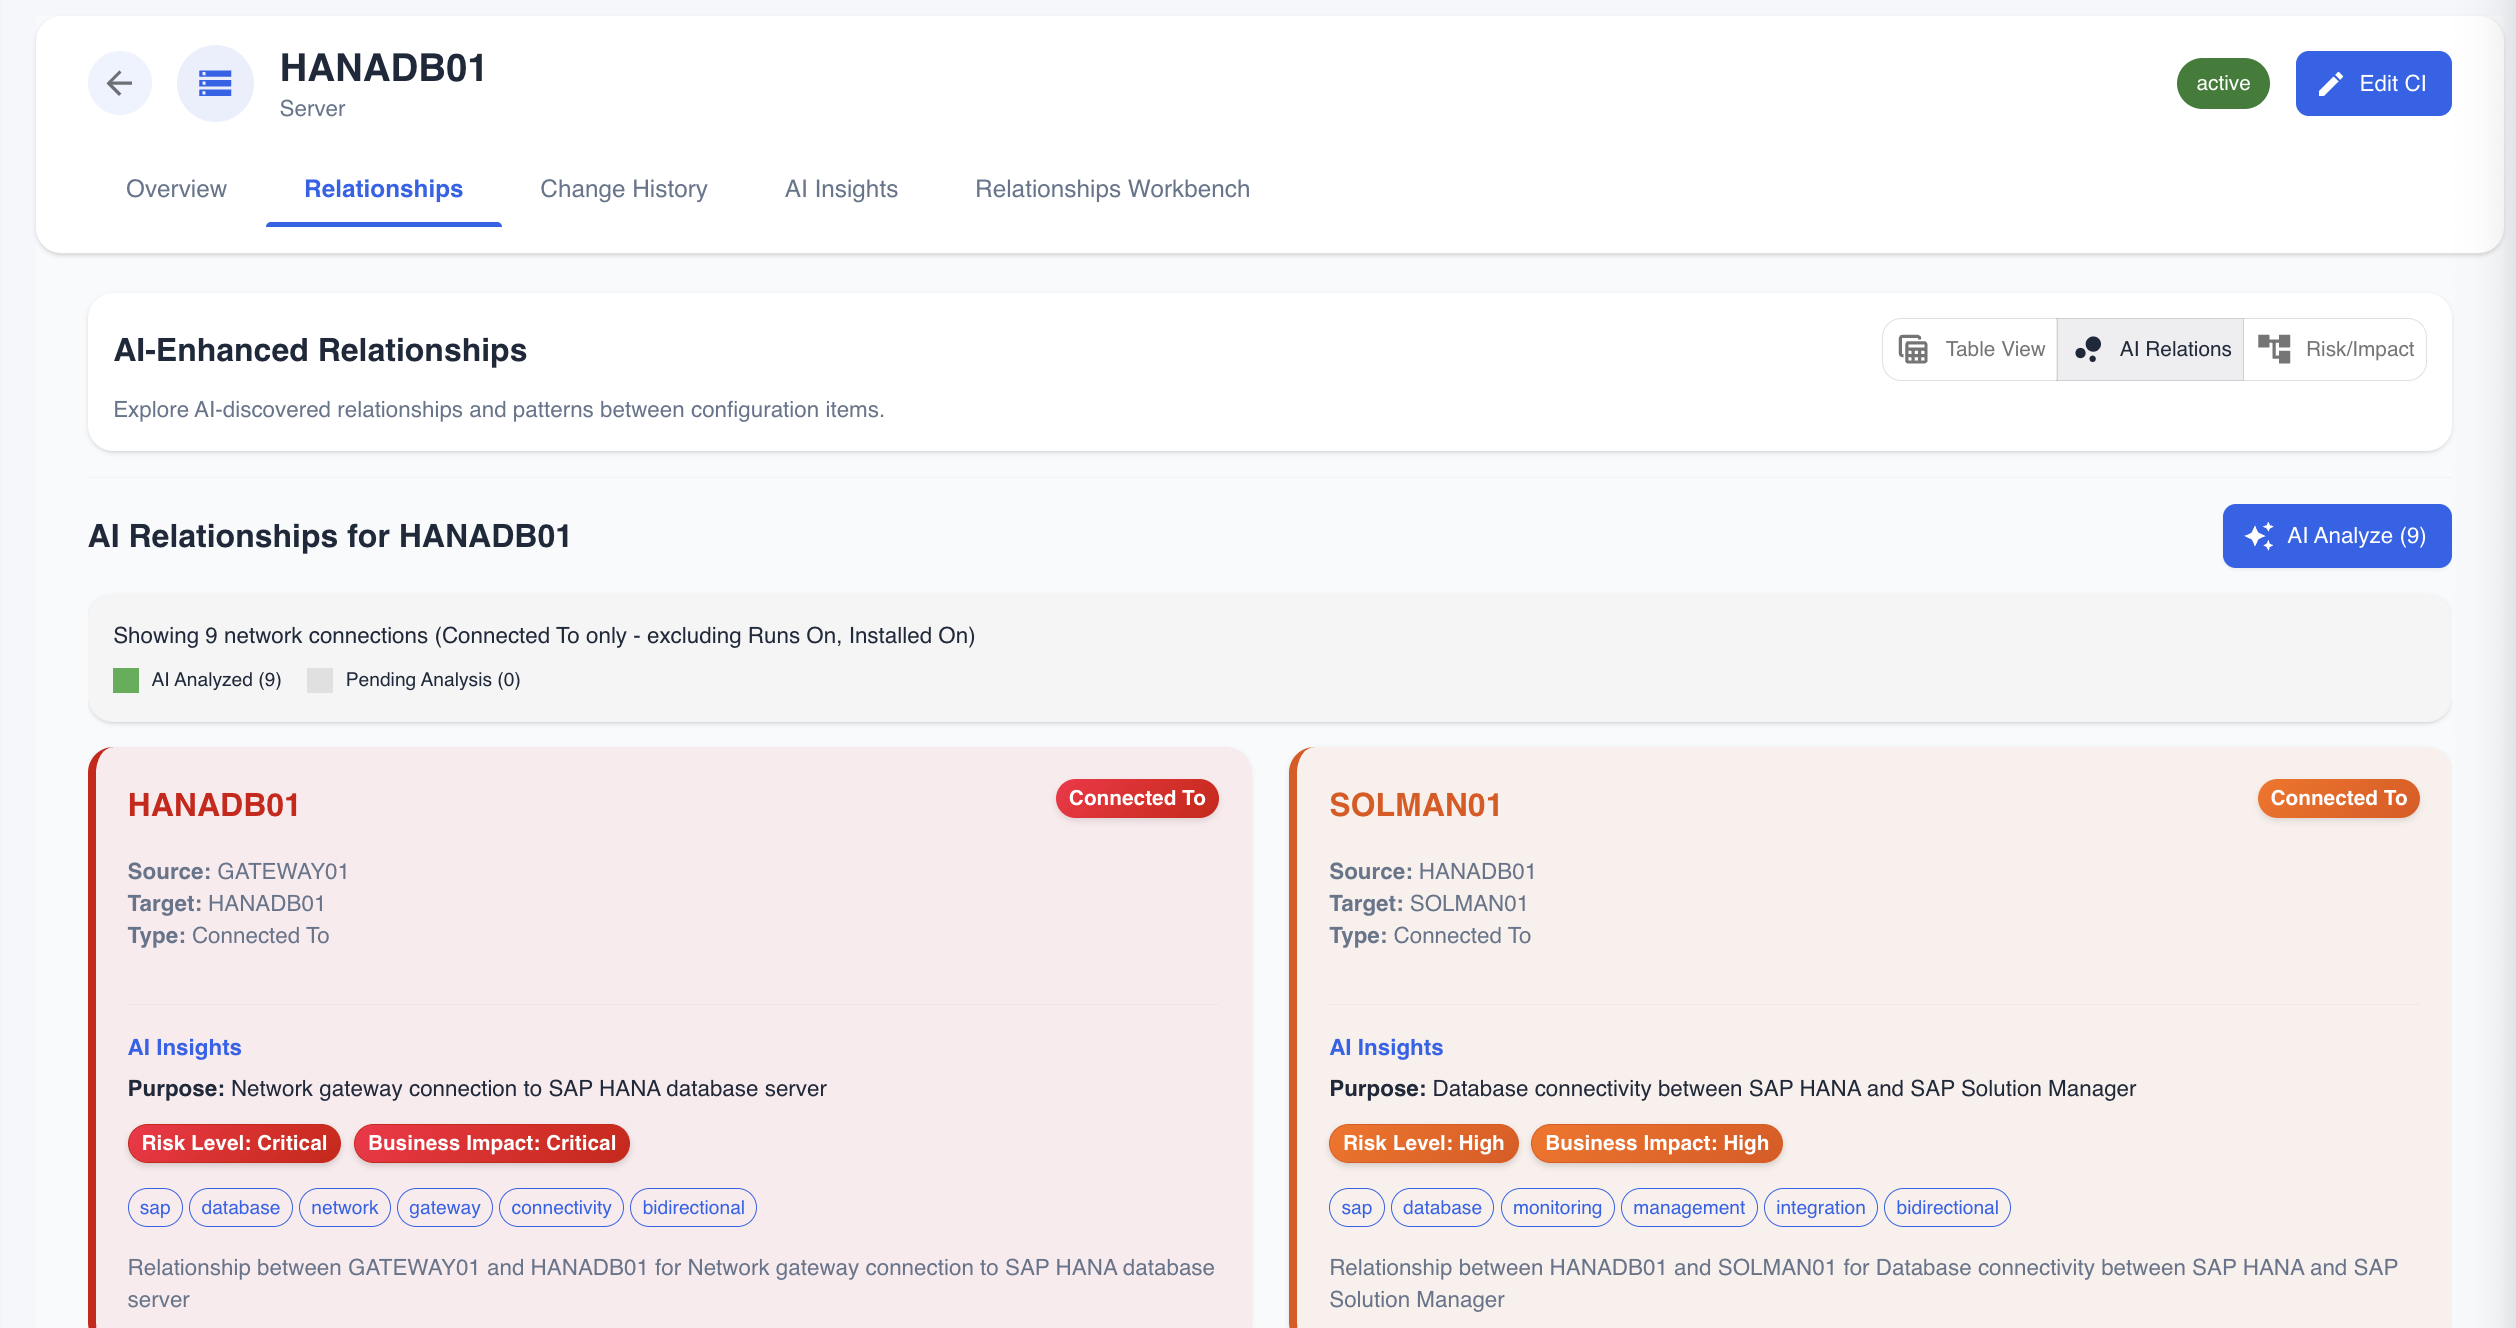
When a server has many relationships, understanding which connections are most critical can be challenging. The AI Relations view provides deep analysis of each relationship with risk and impact assessments.
Accessing AI Relations
- On the Relationships tab, click the AI Relations toggle button (between Table View and Risk/Impact)
- You'll see the AI-Enhanced Relationships view
Understanding the AI Relations Interface
The AI Relations view shows:
- AI Relationships for [Server Name] - Header showing the current server
- Connection count - "Showing 9 network connections (Connected To only - excluding Runs On, Installed On)"
- Analysis status - Green indicator for "AI Analyzed (9)" and grey for "Pending Analysis (0)"
- AI Analyze button - Click to trigger or refresh AI analysis
Triggering AI Analysis
Click the AI Analyze (9) button to:
- Analyze all network connections using AI
- Generate purpose descriptions for each relationship
- Assess risk levels and business impact
- Identify tags and categories
- Create detailed explanations
The analysis uses Claude AI to examine:
- Network connection patterns
- Process and port information
- Known application signatures
- Infrastructure topology
- Business context from installed applications
AI Relationship Cards
Each relationship is displayed as a card with comprehensive AI-generated insights:
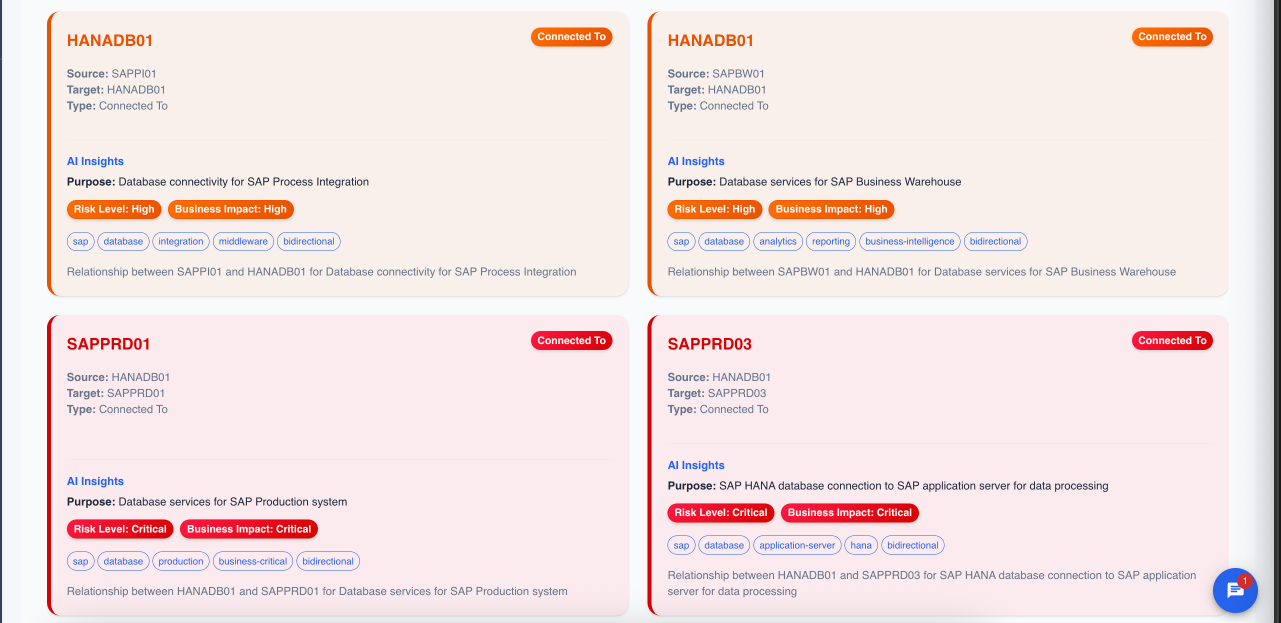
Card Header
- CI Name - The connected server (e.g., HANADB01, SAPPRD01)
- Relationship Badge - "Connected To" in orange
Connection Details
- Source - The server initiating the connection
- Target - The server receiving the connection
- Type - Relationship type (Connected To)
AI Insights Section
Each card includes AI-generated analysis:
Purpose A human-readable description of why this connection exists:
- "Network gateway connection to SAP HANA database server"
- "Database connectivity between SAP HANA and SAP Solution Manager"
- "Database services for SAP Production system"
- "SAP HANA database connection to SAP application server for data processing"
Risk Level Color-coded risk assessment:
- 🔴 Critical (Red) - Essential infrastructure connections
- 🟠 High (Orange) - Important business connections
- 🟡 Medium (Yellow) - Standard operational connections
- 🟢 Low (Green) - Non-critical connections
Business Impact Assessment of business disruption if this connection fails:
- 🔴 Critical - Business operations would stop
- 🟠 High - Significant business disruption
- 🟡 Medium - Some business impact
- 🟢 Low - Minimal business impact
Tags Categorization tags for filtering and grouping:
sap,database,network,gateway,connectivity,bidirectionalmonitoring,management,integrationproduction,business-criticalapplication-server,hanareplication,high-availability,system-replication
Description Detailed explanation of the relationship:
- "Relationship between GATEWAY01 and HANADB01 for Network gateway connection to SAP HANA database server"
- "Relationship between HANADB01 and SAPPRD01 for Database services for SAP Production system"
Example AI Analysis Results
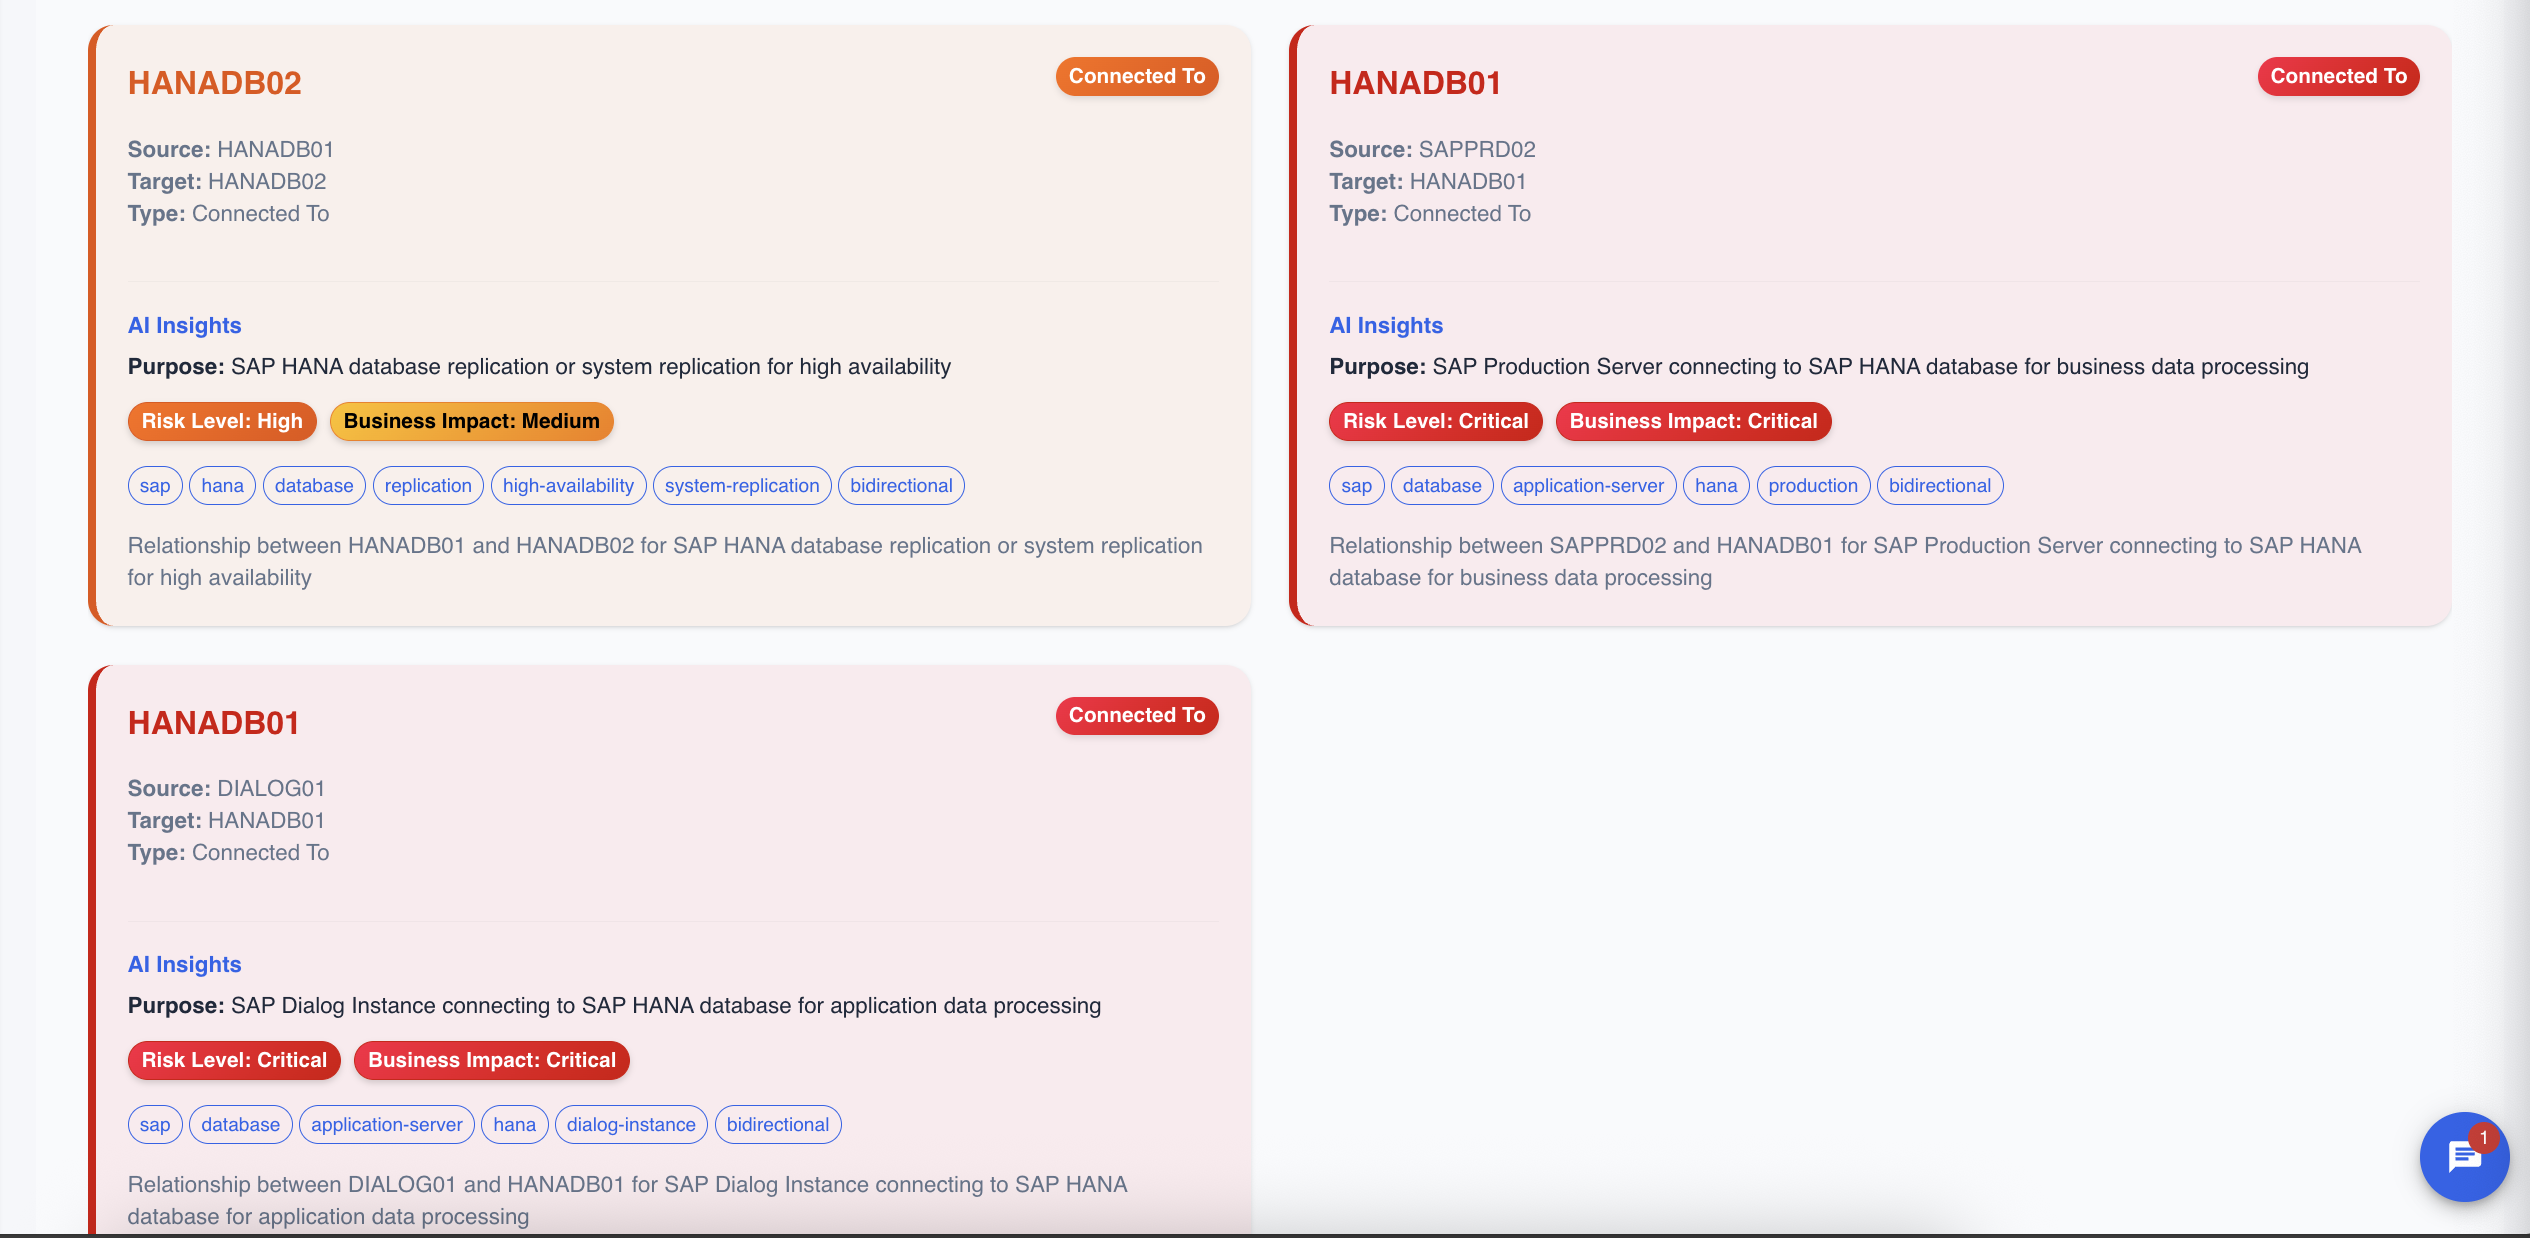
The AI identifies different types of connections:
| Connection | Purpose | Risk | Business Impact |
|---|---|---|---|
| GATEWAY01 → HANADB01 | Network gateway to database | Critical | Critical |
| SOLMAN01 ↔ HANADB01 | SAP Solution Manager monitoring | High | High |
| SAPPI01 → HANADB01 | SAP Process Integration | High | High |
| SAPBW01 → HANADB01 | SAP Business Warehouse | High | High |
| SAPPRD01 ↔ HANADB01 | Production database services | Critical | Critical |
| SAPPRD03 → HANADB01 | Application server data processing | Critical | Critical |
| HANADB02 ↔ HANADB01 | Database replication/HA | High | Medium |
| SAPPRD02 → HANADB01 | Production data processing | Critical | Critical |
| DIALOG01 → HANADB01 | Dialog instance database connection | Critical | Critical |
How AI Analysis Works
The AI relationship processor:
- Collects Connection Data - Gathers all network connections from discovery scans
- Correlates with CIs - Matches IP addresses to known configuration items
- Analyzes Context - Examines processes, ports, and installed applications
- Generates Insights - Uses AI to determine:
- The business purpose of each connection
- Risk level based on criticality and redundancy
- Business impact based on affected services
- Relevant tags for categorization
- Stores Results - Saves AI metadata for future reference
Using AI Relations for Change Management
Before making changes to a server:
- Review all Critical and High risk relationships
- Identify which business services depend on these connections
- Plan maintenance windows to minimize impact
- Prepare communication for affected stakeholders
- Create rollback procedures for critical connections
Refreshing AI Analysis
Click the AI Analyze button to refresh the analysis when:
- New connections have been discovered
- Server configurations have changed
- You need updated risk assessments
- Installed applications have been modified
The analysis status shows:
- AI Analyzed (N) - Number of connections with completed analysis
- Pending Analysis (N) - Connections awaiting analysis
AI Insights Tab
The AI Insights tab provides comprehensive AI-generated analysis of the server, covering hardware, software, security, relationships, and actionable recommendations. Unlike the AI Relations view which focuses on individual connections, AI Insights provides a holistic analysis of the entire CI.
Accessing AI Insights
- On the server detail page, click the AI Insights tab
- If no insights exist yet, click Regenerate Insights to generate them
- To refresh existing insights, click Refresh or Regenerate Insights
Generating and Refreshing Insights
AI Insights are manually initiated - they are not automatically generated during discovery. This allows you to:
- Control when AI analysis runs
- Regenerate insights after significant changes
- Manage AI processing costs
Buttons available:
- Refresh - Reload the current insights from the database
- Regenerate Insights - Trigger a new AI analysis using Claude
Insight Categories
The AI Insights tab has three sub-tabs for different analysis perspectives:
| Tab | Focus Area |
|---|---|
| Advanced Analysis | Infrastructure, hardware, software, and operational insights |
| Compliance | Regulatory compliance assessment and gaps |
| Security | Security posture and vulnerability analysis |
Advanced Analysis Tab
The Advanced Analysis provides comprehensive insights organized into sections:
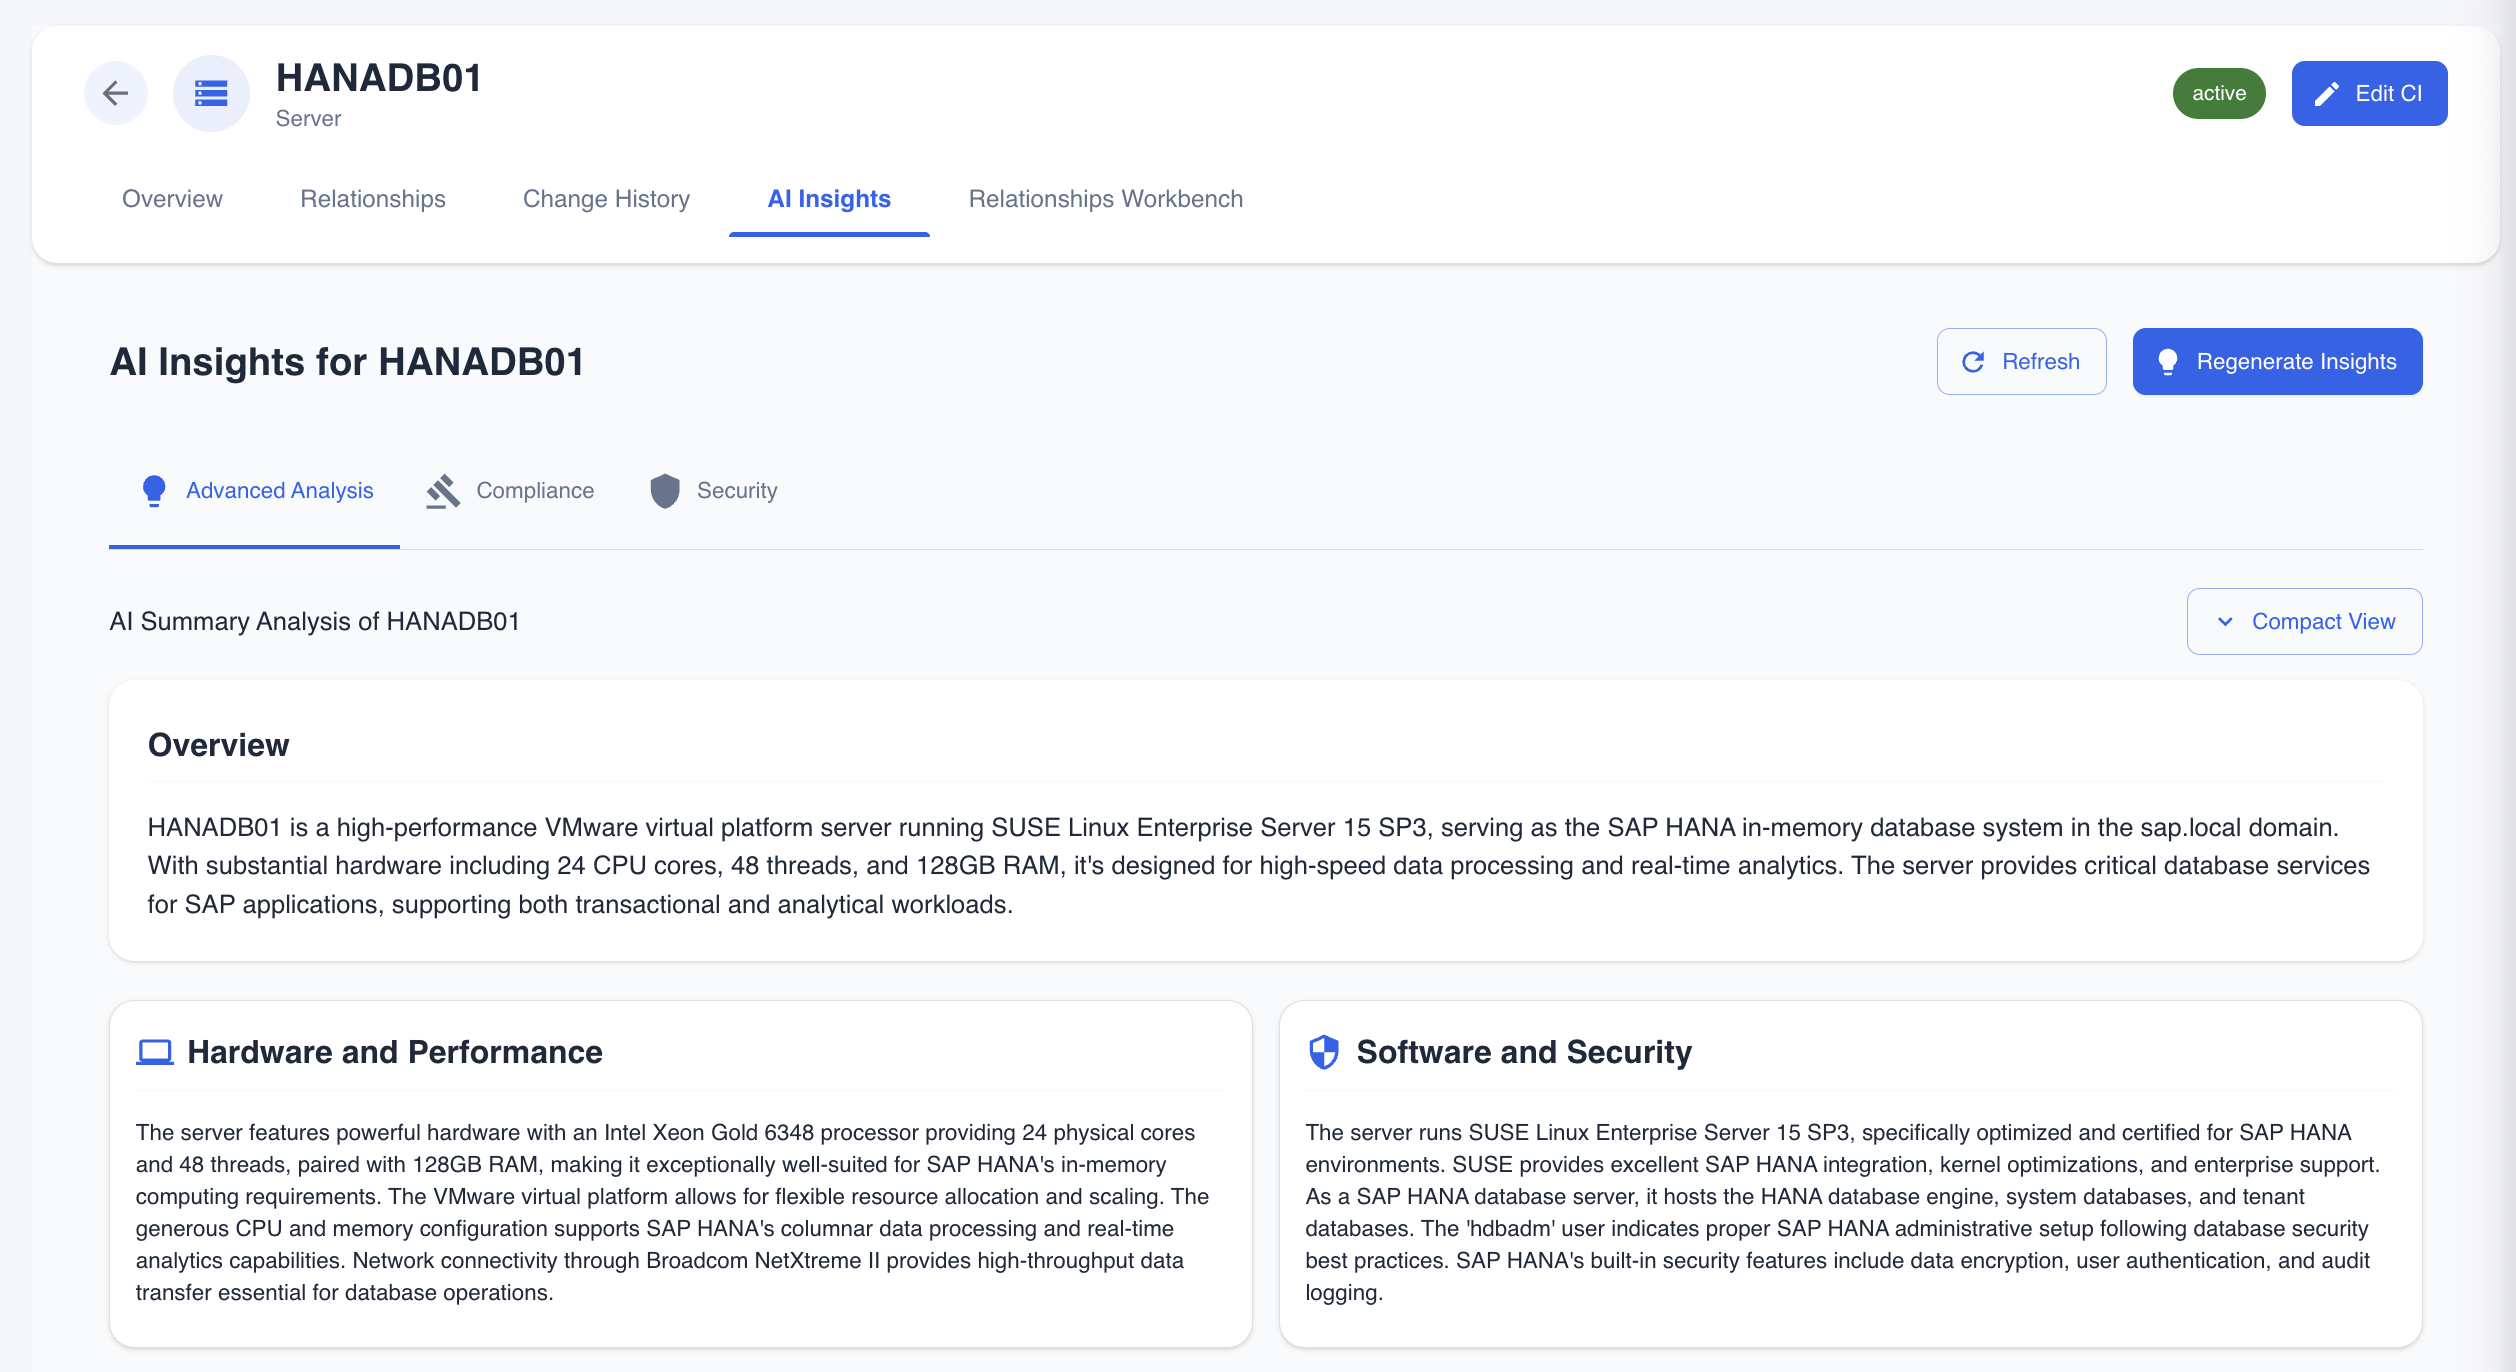
Overview
A high-level summary of the server's purpose and role:
"HANADB01 is a high-performance VMware virtual platform server running SUSE Linux Enterprise Server 15 SP3, serving as the SAP HANA in-memory database system in the sap.local domain. With substantial hardware including 24 CPU cores, 48 threads, and 128GB RAM, it's designed for high-speed data processing and real-time analytics. The server provides critical database services for SAP applications, supporting both transactional and analytical workloads."
Hardware and Performance
Analysis of the server's hardware configuration:
- CPU specifications (Intel Xeon Gold 6348, 24 cores, 48 threads)
- Memory configuration (128GB RAM for in-memory computing)
- VMware virtual platform flexibility
- Resource allocation for SAP HANA requirements
- Network connectivity (Broadcom NetXtreme II for high-throughput)
Software and Security
Software stack analysis:
- Operating system (SUSE Linux Enterprise Server 15 SP3)
- SAP HANA certification and optimization
- Database engine, system databases, and tenant databases
- Administrative user configuration (hdbadm)
- Built-in security features (encryption, authentication, audit logging)

Network and Connectivity
Network configuration and dependencies:
- IP address and MAC address configuration
- High-performance networking for database transactions
- Data replication and backup operations
- Connections to SAP application servers (SAPPRD01, GATEWAY01)
- SAP landscape data flow
User Account Security
Security configuration assessment:
- Administrative account setup (hdbadm)
- Domain integration (sap.local)
- Database-specific access controls
- SQL permissions and privilege controls
- Database encryption and backup security
Redundancy and Availability
Business continuity assessment:
- High availability requirements
- System replication capabilities
- Backup and recovery recommendations
- Point-in-time recovery needs
- Zero-downtime operations potential

Key Relationships
Critical connections identified with impact levels:
| Server | Impact | Description |
|---|---|---|
| SAPPRD01 | Critical | Primary SAP application server for business data and transactional processing |
| GATEWAY01 | Critical | Gateway server connection for external SAP access and Fiori applications |
| SOLMAN01 | High | Solution Manager connection for database monitoring and system management |
| SAPBW01 | High | Business Warehouse connection for analytical data processing and reporting |
Recommendations
AI-generated actionable recommendations:
- Implement SAP HANA system replication for high availability and disaster recovery
- Set up automated HANA database backups with point-in-time recovery
- Configure HANA performance monitoring and memory management optimization
- Implement HANA data encryption for data at rest and in transit
- Set up HANA database audit logging and security monitoring
- Configure HANA system landscape and tenant database optimization
- Implement HANA backup verification and recovery testing procedures
- Set up HANA cockpit for database administration and monitoring
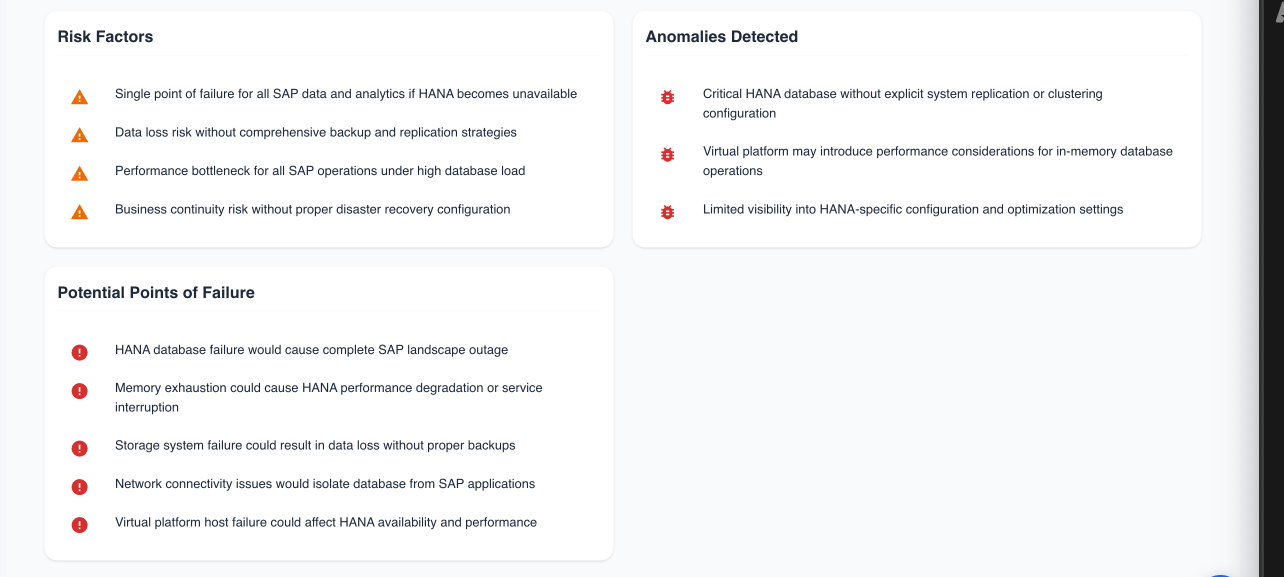
Risk Factors
Identified risks requiring attention:
- ⚠️ Single point of failure for all SAP data and analytics if HANA becomes unavailable
- ⚠️ Data loss risk without comprehensive backup and replication strategies
- ⚠️ Performance bottleneck for all SAP operations under high database load
- ⚠️ Business continuity risk without proper disaster recovery configuration
Anomalies Detected
Configuration concerns identified:
- 🔴 Critical HANA database without explicit system replication or clustering configuration
- 🔴 Virtual platform may introduce performance considerations for in-memory database operations
- 🔴 Limited visibility into HANA-specific configuration and optimization settings
Potential Points of Failure
Failure scenarios to mitigate:
- ❌ HANA database failure would cause complete SAP landscape outage
- ❌ Memory exhaustion could cause HANA performance degradation or service interruption
- ❌ Storage system failure could result in data loss without proper backups
- ❌ Network connectivity issues would isolate database from SAP applications
- ❌ Virtual platform host failure could affect HANA availability and performance
What Data Is Analyzed
The AI Insights processor analyzes:
-
Raw Scan Data - WMI/SSH scan results including:
- System information (OS, manufacturer, model)
- Hardware specifications (CPU, memory, storage)
- Network adapters and configuration
- Installed software and versions
- User accounts (count only, not details)
- Running services and processes
-
CI Relationships - Connected servers and dependencies
-
Installed Applications - Software inventory with versions
-
Network Connections - Active connections and listening ports
How Analysis Works
- Data Collection - The system gathers all available data about the CI
- Data Cleaning - Sensitive information (user account details) is redacted
- AI Processing - Claude AI analyzes the data using expert IT systems knowledge
- Insight Generation - Structured insights are generated covering:
- Security vulnerabilities and misconfigurations
- Infrastructure assessment and capacity planning
- Software inventory and version management
- Network connectivity and dependencies
- Configuration optimization opportunities
- Storage - Insights are saved and linked to the CI for future reference
Using AI Insights
AI Insights help you:
- Understand Server Role - Get a clear overview of what the server does and why it matters
- Assess Security Posture - Identify security gaps and vulnerabilities
- Plan Capacity - Understand resource utilization and scaling needs
- Prioritize Actions - Focus on critical recommendations first
- Document Infrastructure - Maintain up-to-date documentation automatically
- Prepare for Changes - Understand risks before making modifications
Best Practices
- Regenerate after major changes - Run new analysis after software updates, configuration changes, or relationship modifications
- Review regularly - Check insights periodically to catch new issues
- Act on Critical items first - Address Critical and High impact recommendations before Medium and Low
- Use with AI Relations - Combine with AI Relations view for complete understanding
Next Steps
- Business Service Analyzer - Map business services to infrastructure components