Analyze Infrastructure
The Infrastructure Service Analysis is the recommended starting point for mapping your environment. It acts as an "Auto-Discovery" engine that scans your entire inventory against a library of predefined Service Patterns (e.g., Exchange, CyberArk, SAP) to automatically identify and classify business services.
How It Works
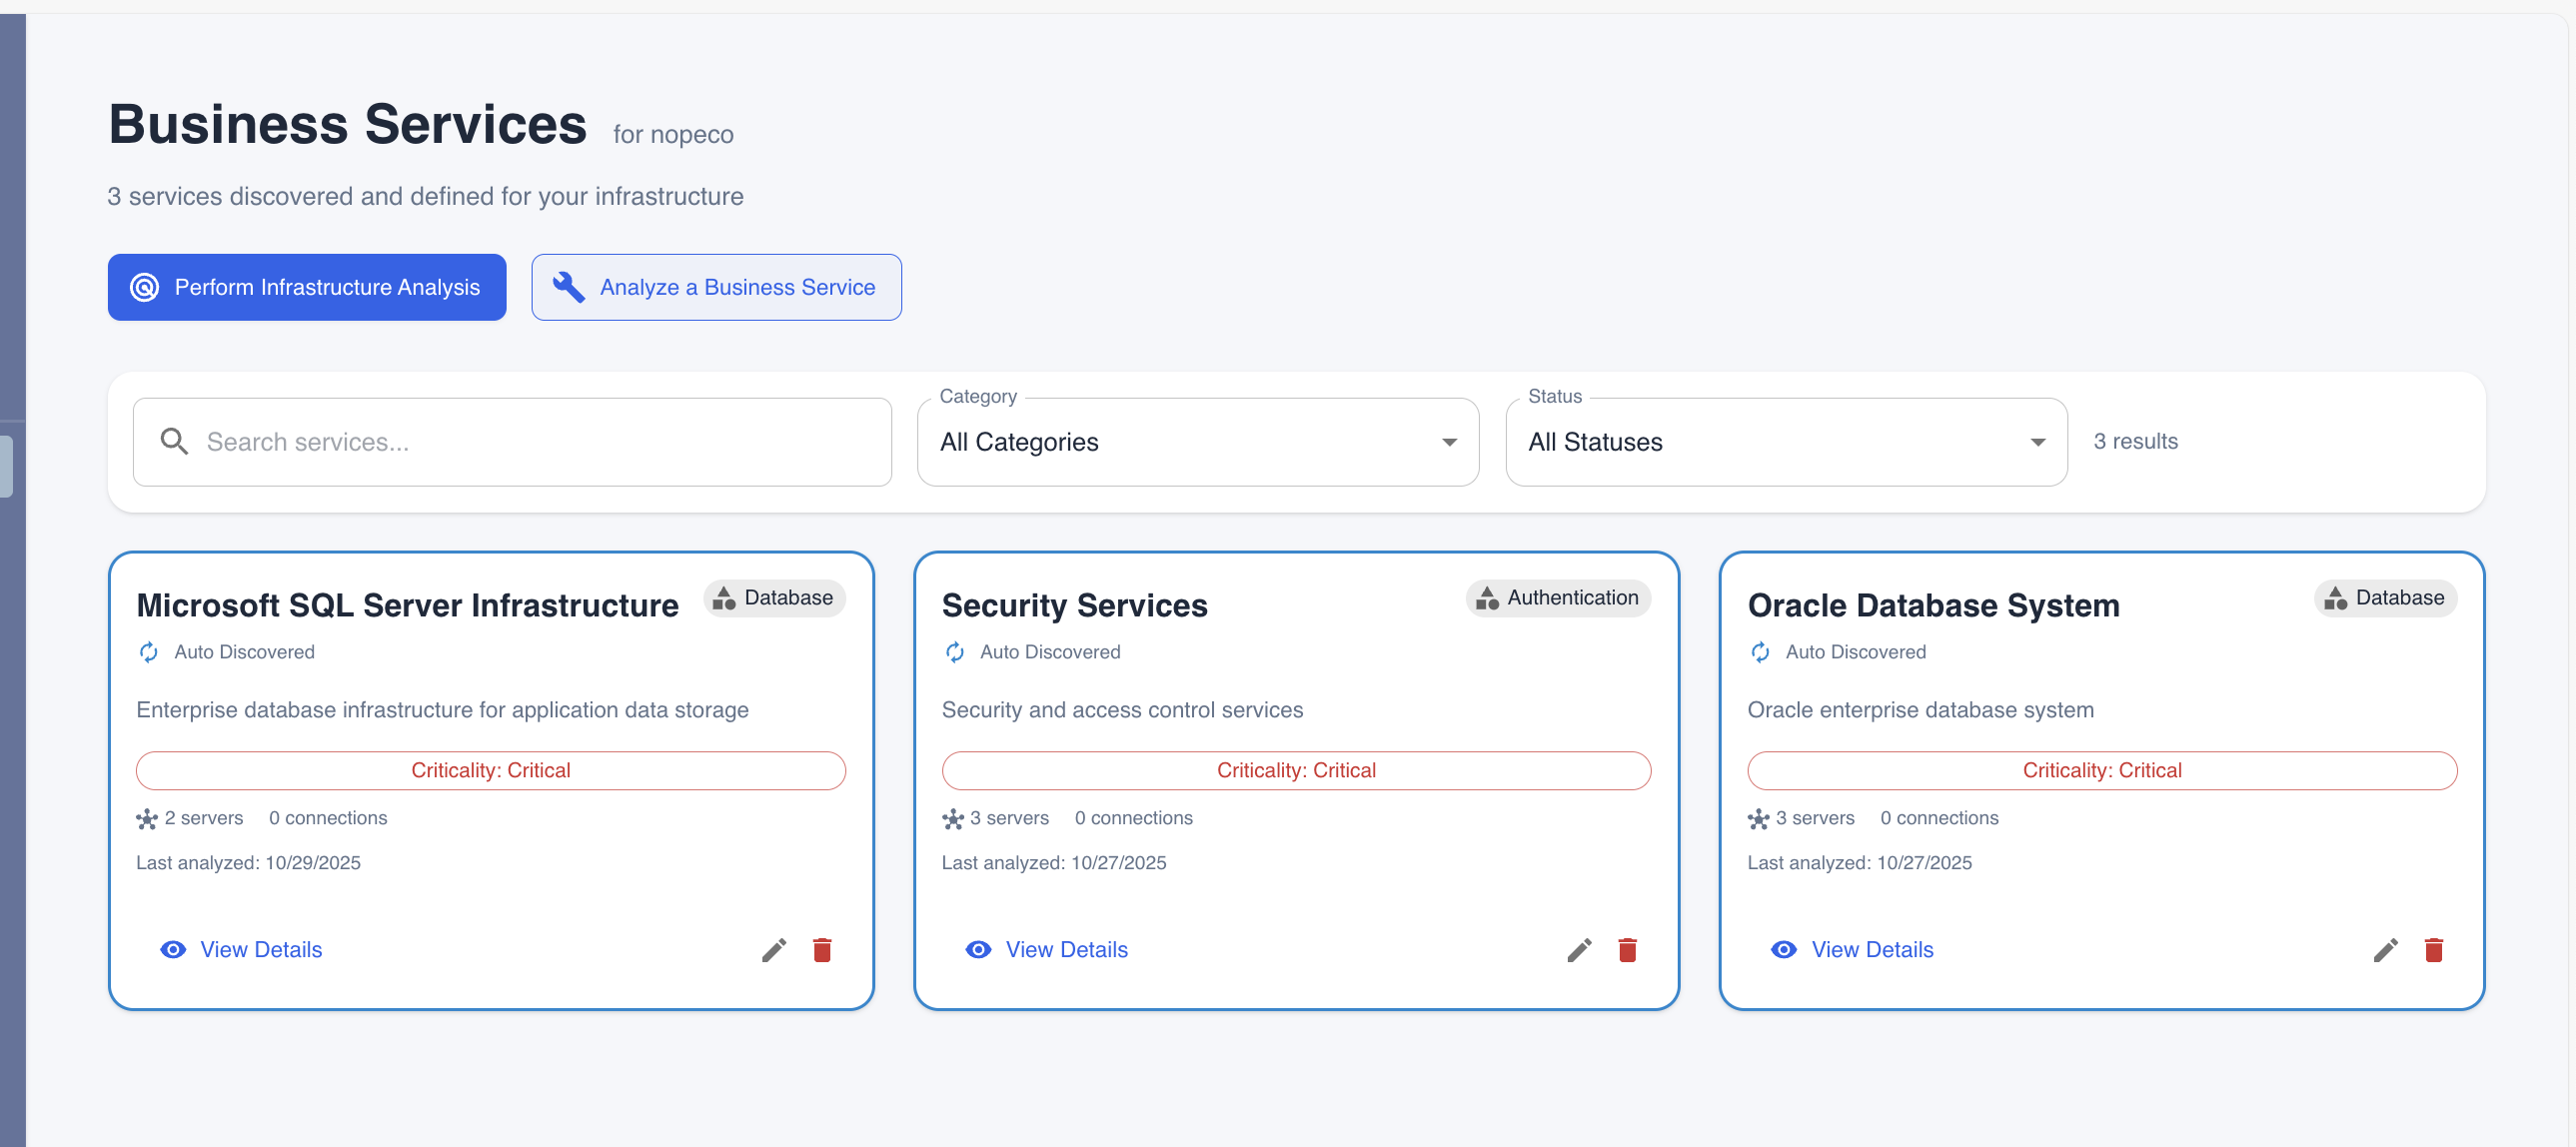
- Navigate to CMDB > Business Service Analyzer.
 Figure 1: Accessing the Business Service Analyzer dashboard.
- Locate the Infrastructure Service Analysis card (marked as "Recommended").
- Click the Start Infrastructure Analysis button.
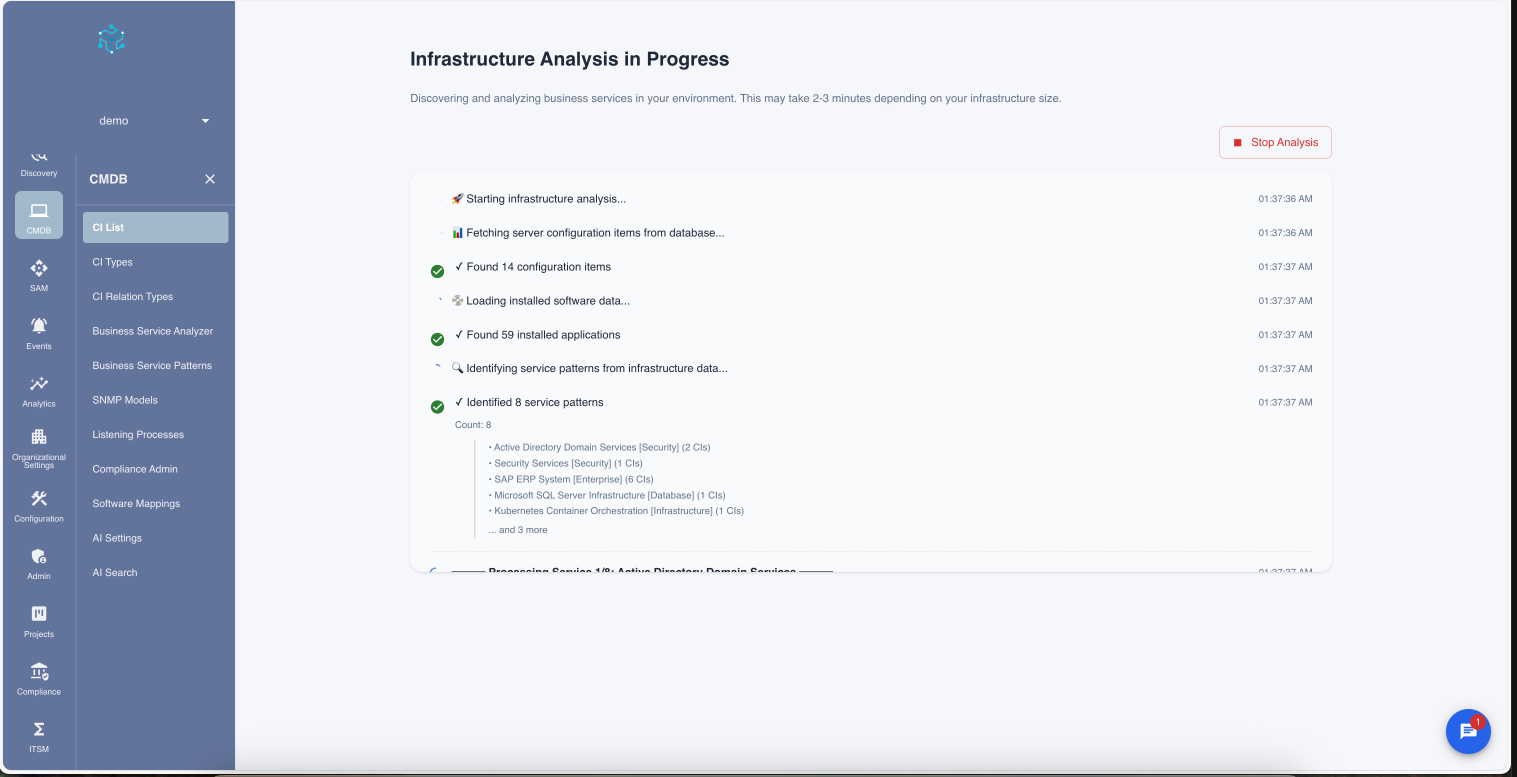
The system will immediately begin a multi-step analysis process.
 Figure 2: The system identifying patterns across your infrastructure.
Understanding the Analysis Logic
The infrastructure analysis is not a simple keyword search. It uses a sophisticated multi-layer logic to ensure accuracy and reduce noise.
1. Pattern Matching
The system loads active Service Patterns from the database. Each pattern defines a "fingerprint" for a service using a combination of criteria. A server is identified if it matches either the hostname patterns or the software keywords:
- Hostname Patterns (Optional): e.g.,
*sql*,*exch*. If defined, the system performs a case-insensitive substring match against the server's hostname. This allows identifying servers even if software discovery is incomplete (e.g., identifyingPRD-SQL-01as a database). - Software Keywords: e.g., "Microsoft Exchange Server", "CyberArk Password Vault". Checks the installed software inventory.
- Process Signatures: Specific executables that must be running.
It first scans all discovered Server CIs to find matches against these fingerprints.
It first scans all discovered Server CIs to find matches against these fingerprints.
2. Deep Discovery & Validation
Once a potential service is identified (e.g., "Possible Exchange Server found"), the system validates it using Deep Discovery:
- Process Verification: It checks the live process list for required components defined in the pattern.
- Connection Analysis: It analyzes network traffic to confirm the server is communicating on expected ports (e.g., Port 25/443 for Exchange).
3. Classification & Enrichment
This is where the AI adds value. It doesn't just list servers; it understands their roles.
- Role Assignment: Based on the processes running, it tags servers as
web-server,database,app-server, etc. - Tiering: It organizes components into logical tiers:
frontend(User facing),application(Business logic),data(Storage), andinfrastructure(Support).
4. AI Insights Generation
Finally, the results are passed to the AI engine (Claude) to generate a health and risk assessment. The AI looks for:
- Architectural Risks: Single points of failure or non-standard configurations.
- Security Gaps: Unencrypted connections or exposed administrative interfaces.
- Business Impact: Estimating the criticality of the service based on its dependencies.
Reviewing Results
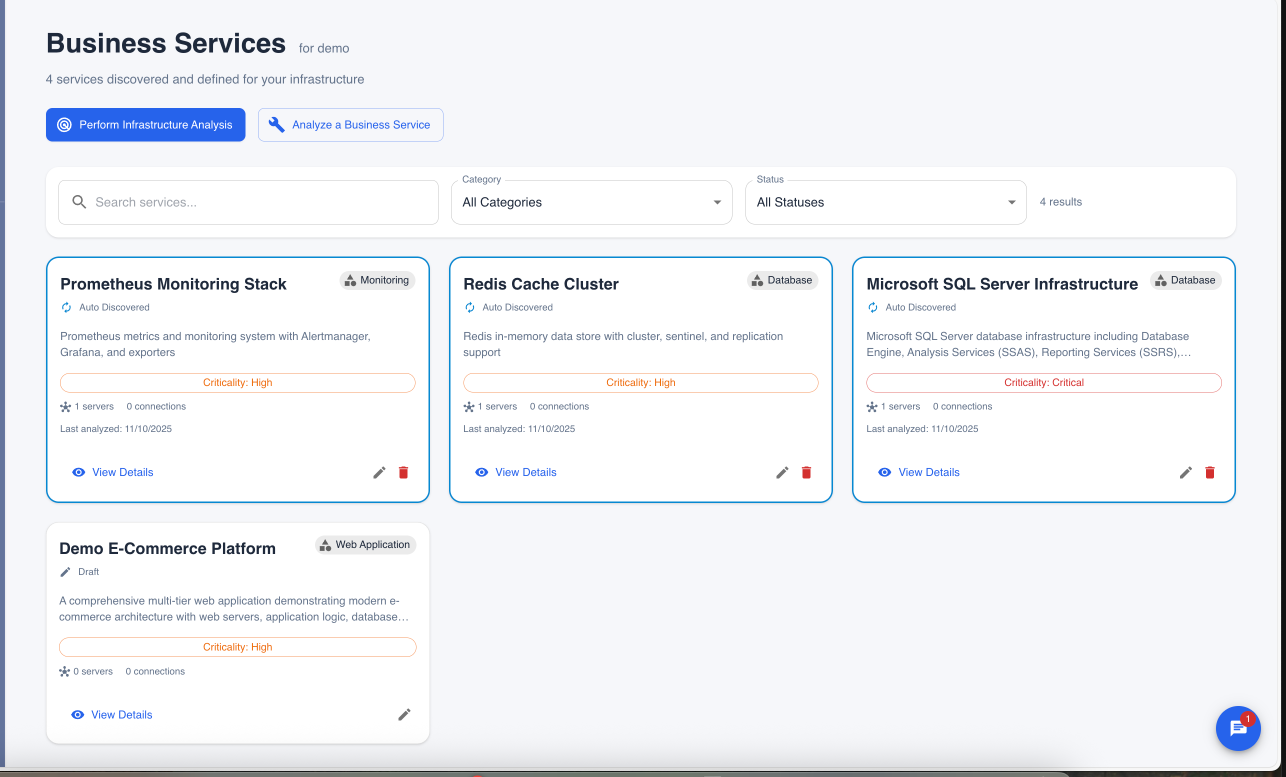
Once the analysis is complete, you are presented with a comprehensive list of potential services found in your environment.
 Figure 3: Reviewing discovered services with automatic role classification.
The results provide detailed classification:
- Service Name: The identified service (e.g., "SolarWinds Network Monitoring Platform").
- Server Roles: Each server is automatically assigned a specific role (e.g.,
web-server,database,app-server) based on the processes running on it. - Tiers: Components are organized into architectural tiers (
frontend,application,data,infrastructure). - Confidence: An AI-calculated score indicating the certainty of the match.
You can simply check the boxes for the services you want to keep and save them to your CMDB.