CI Workbench: The Relationship Cockpit
The CI Workbench is a modern, full-screen intelligence dashboard for managing and visualizing CI relationships. It combines the functionality of a Network Operations Center (NOC) with the intuitive design of a flight cockpit, providing a comprehensive environment for analysis, troubleshooting, and planning.
The Workbench Interface
The interface is designed for deep analysis of a Configuration Item (CI) and its complex web of relationships. It provides powerful tools to explore connections, software components, and network dependencies in a highly visual and interactive manner.
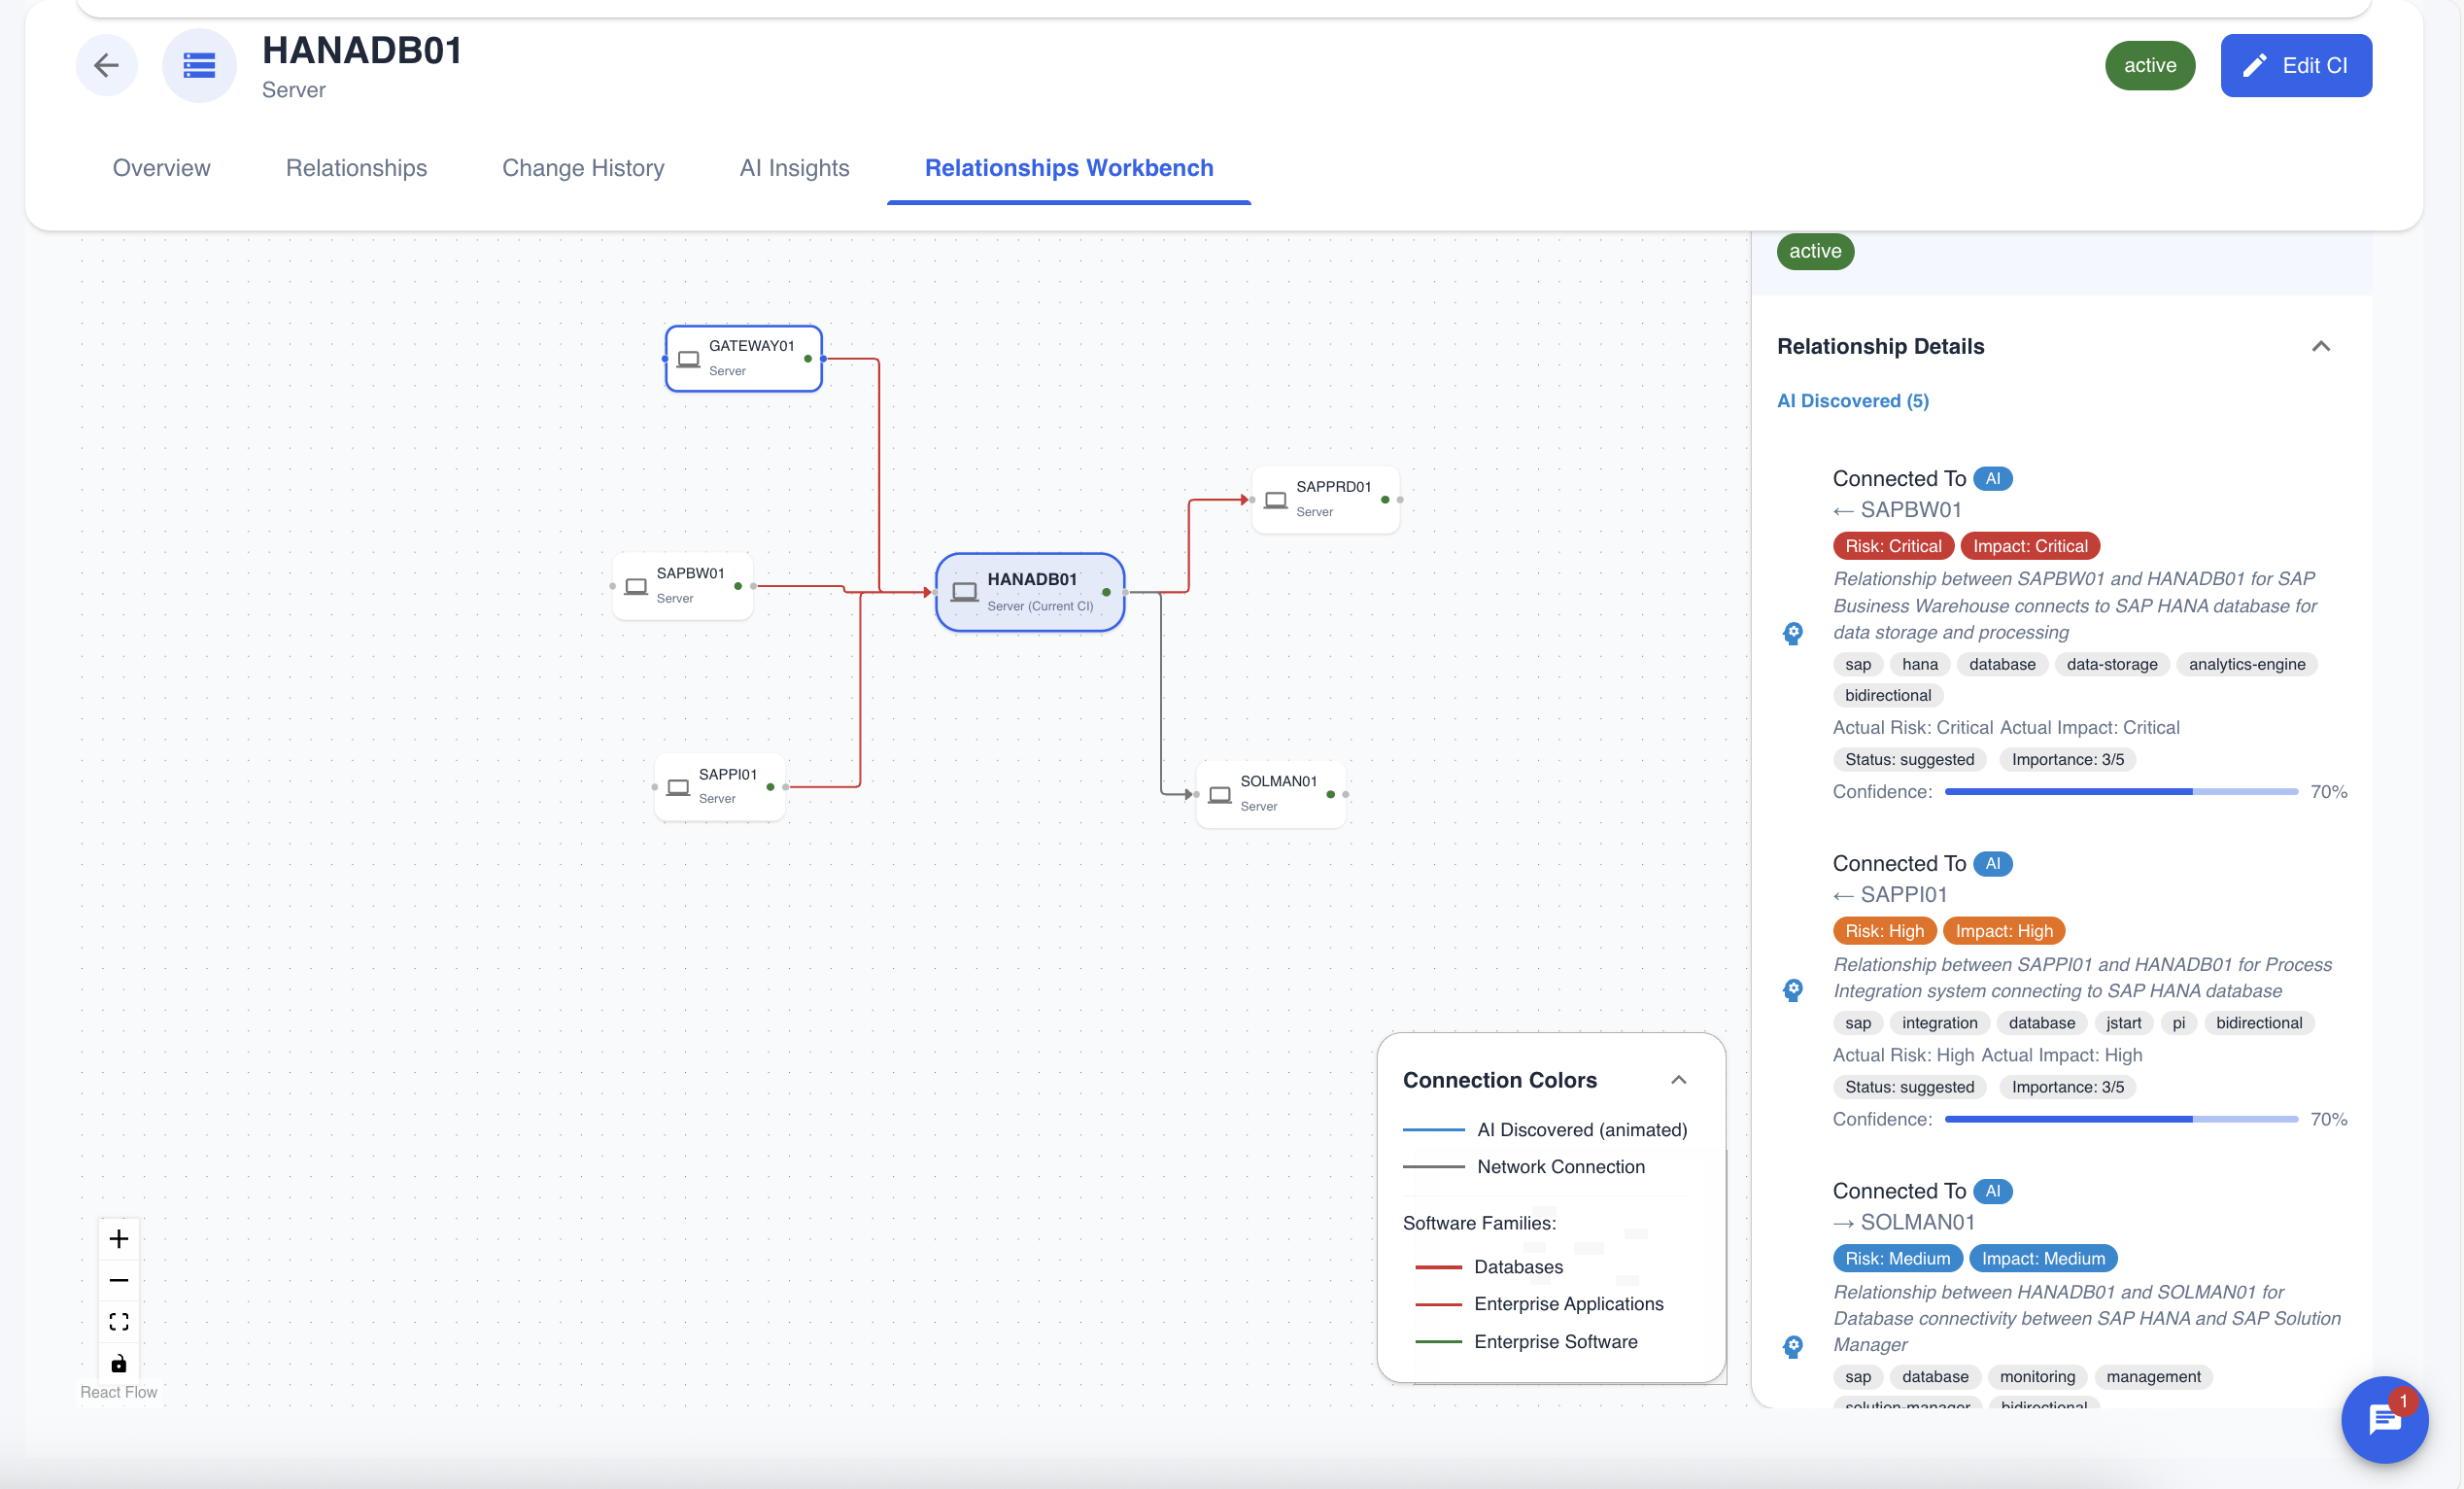 Figure 1: The main CI Workbench interface, showing a network of interconnected CIs.
- Main Visualization Area: The central part of the screen where you can view relationships in a diagram or table format.
- Top Toolbar: Contains controls for switching views, refreshing data, searching, and accessing different diagram modes.
- Inspector Panel (Right): Shows detailed information about any selected CI or relationship.
- Insights Console (Bottom): A multi-purpose, tabbed console for AI-driven analysis, security alerts, and activity logs.
- Configuration Panel: Allows you to customize the view, including filters, grouping, and layout options.
Key Features and Use Cases
The CI Workbench is more than just a visualization tool. It's an interactive command center for exploring and understanding your IT environment.
Analyzing a CI's Software Composition
The workbench allows for a deep analysis of a CI's software inventory. Instead of just listing installed software, it visualizes the software as related components. The AI engine automatically categorizes and groups this software, providing a clear, structured overview of the CI's software ecosystem.
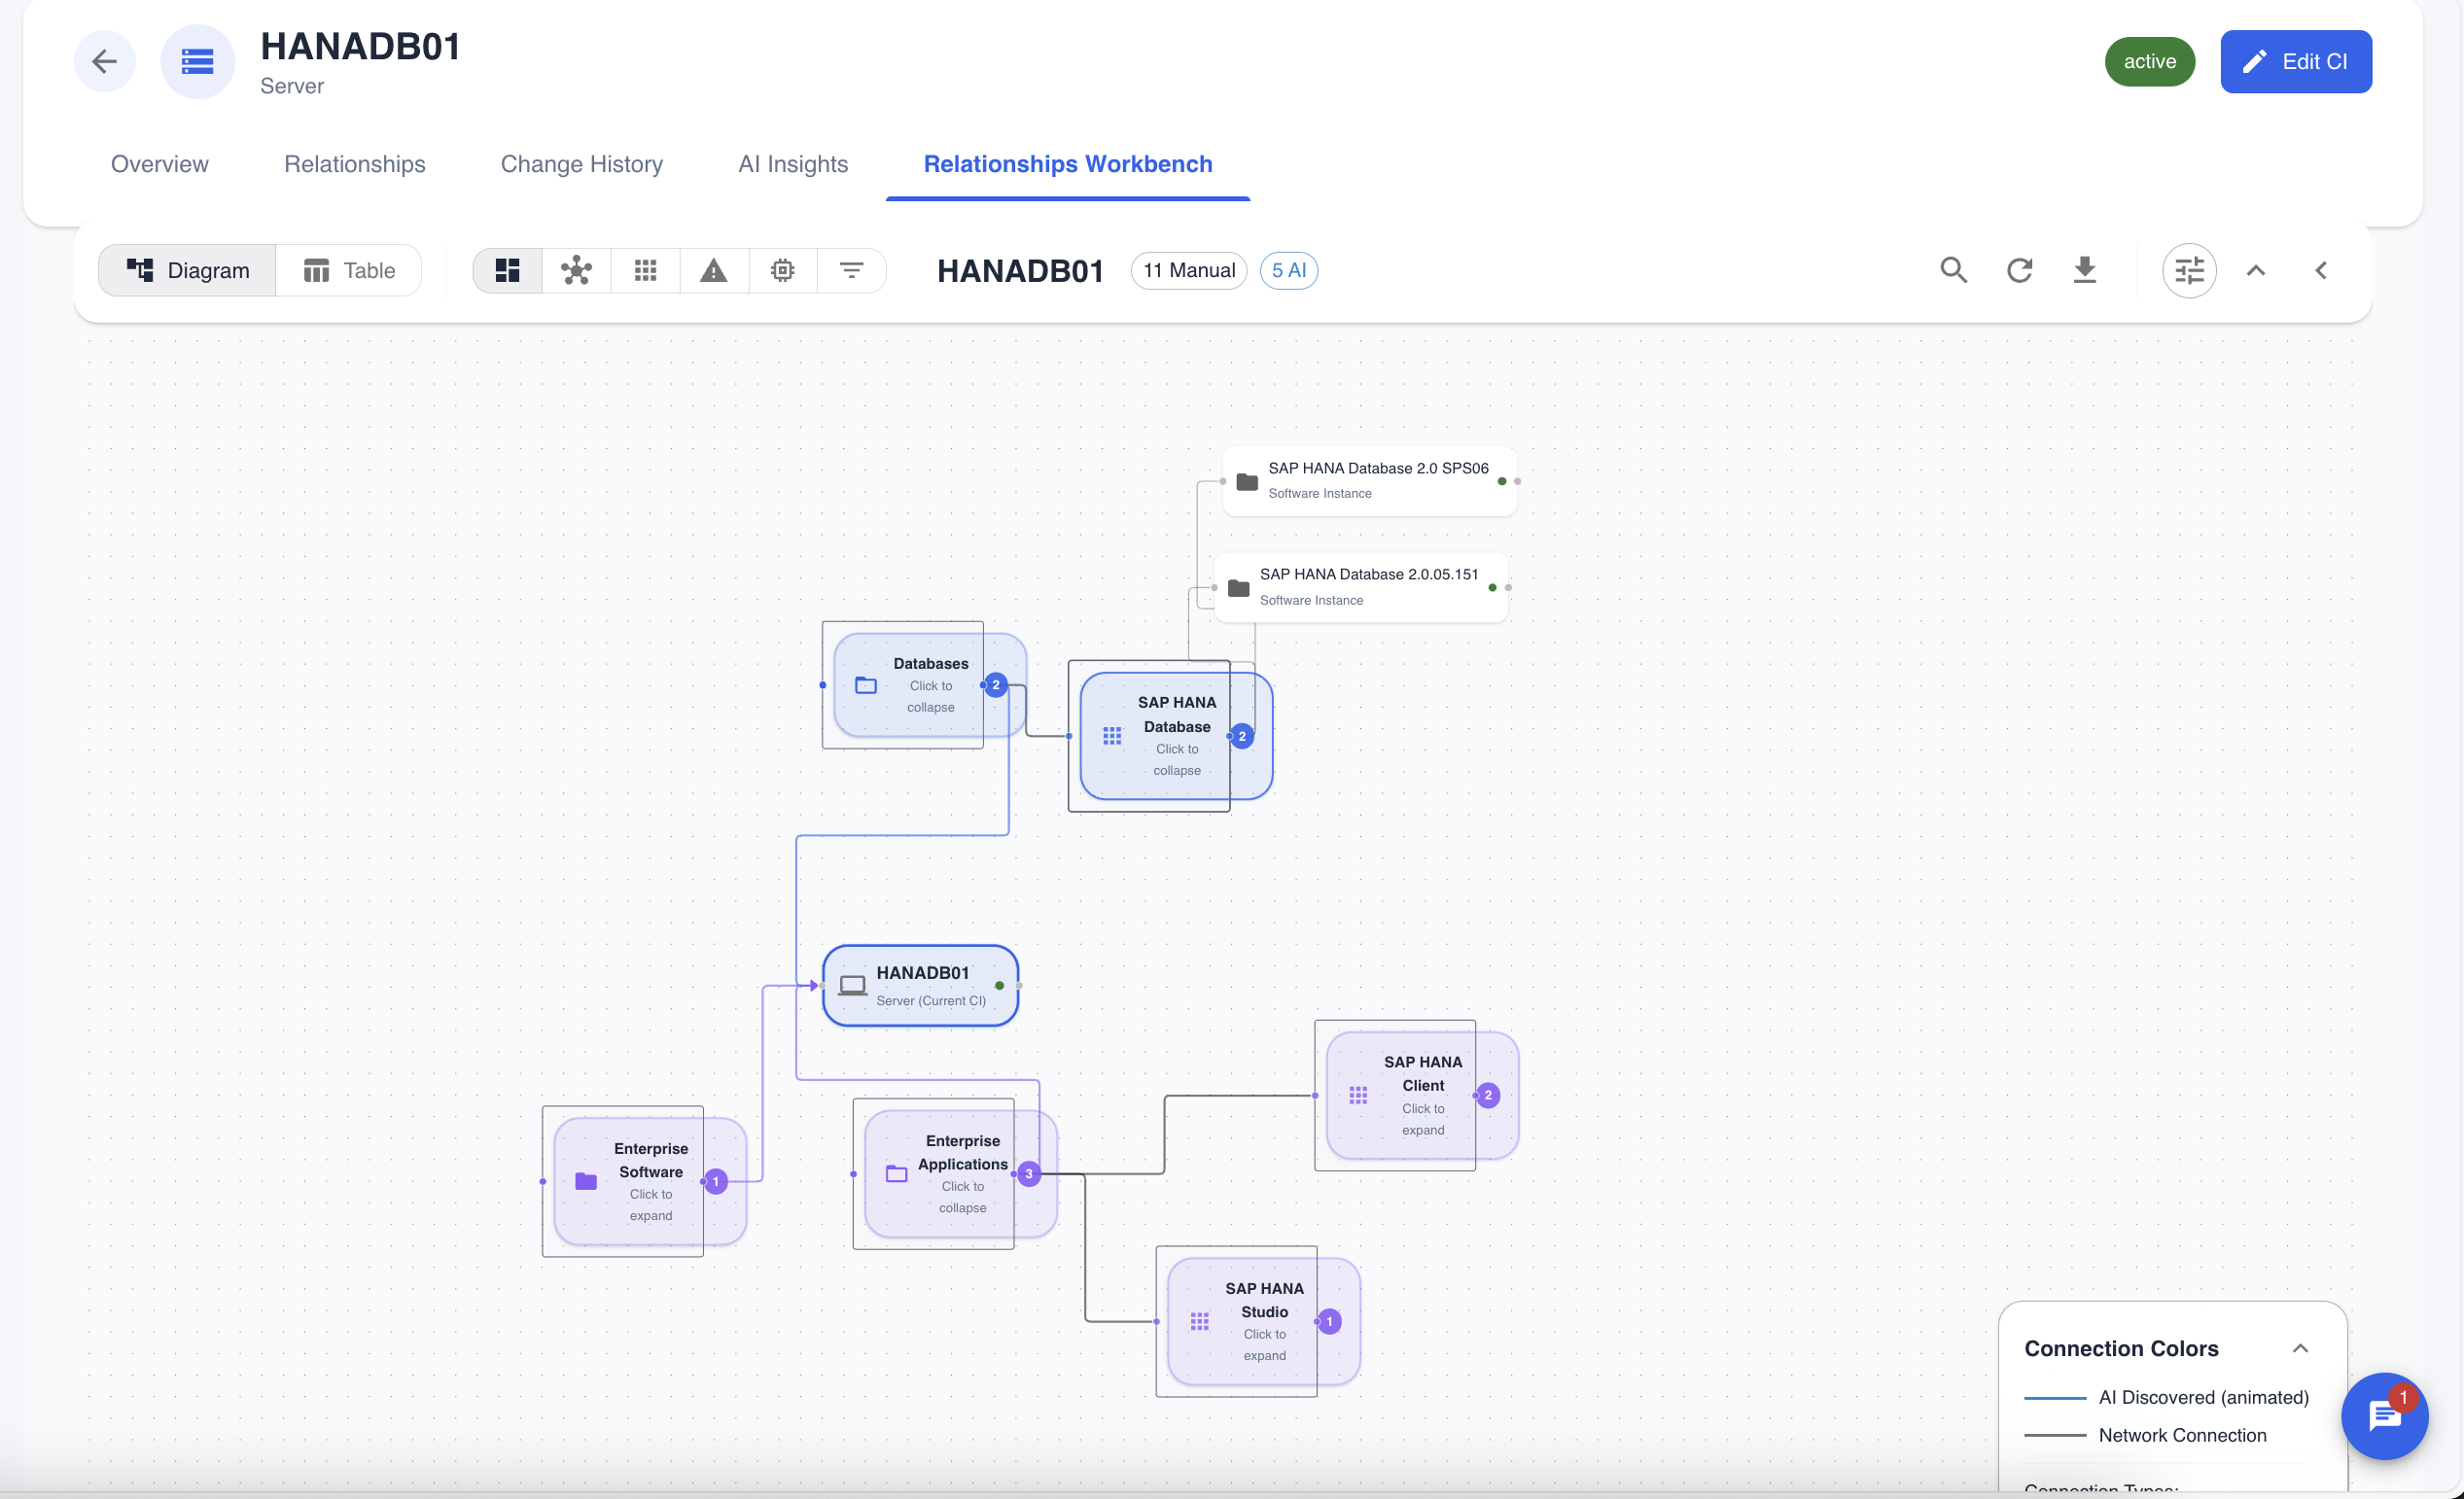 Figure 2: Visualizing the software composition of a server. The AI has identified and categorized installed software like "Microsoft SQL Server" and "Windows Defender".
Smart Grouping of Software
To manage complexity in software-heavy environments, the workbench employs a "Smart Grouping" feature specifically for software components. This automatically groups related software instances based on their AI-categorized software family or application name, reducing clutter and providing a high-level overview. You can expand or collapse these groups to drill down into the details.
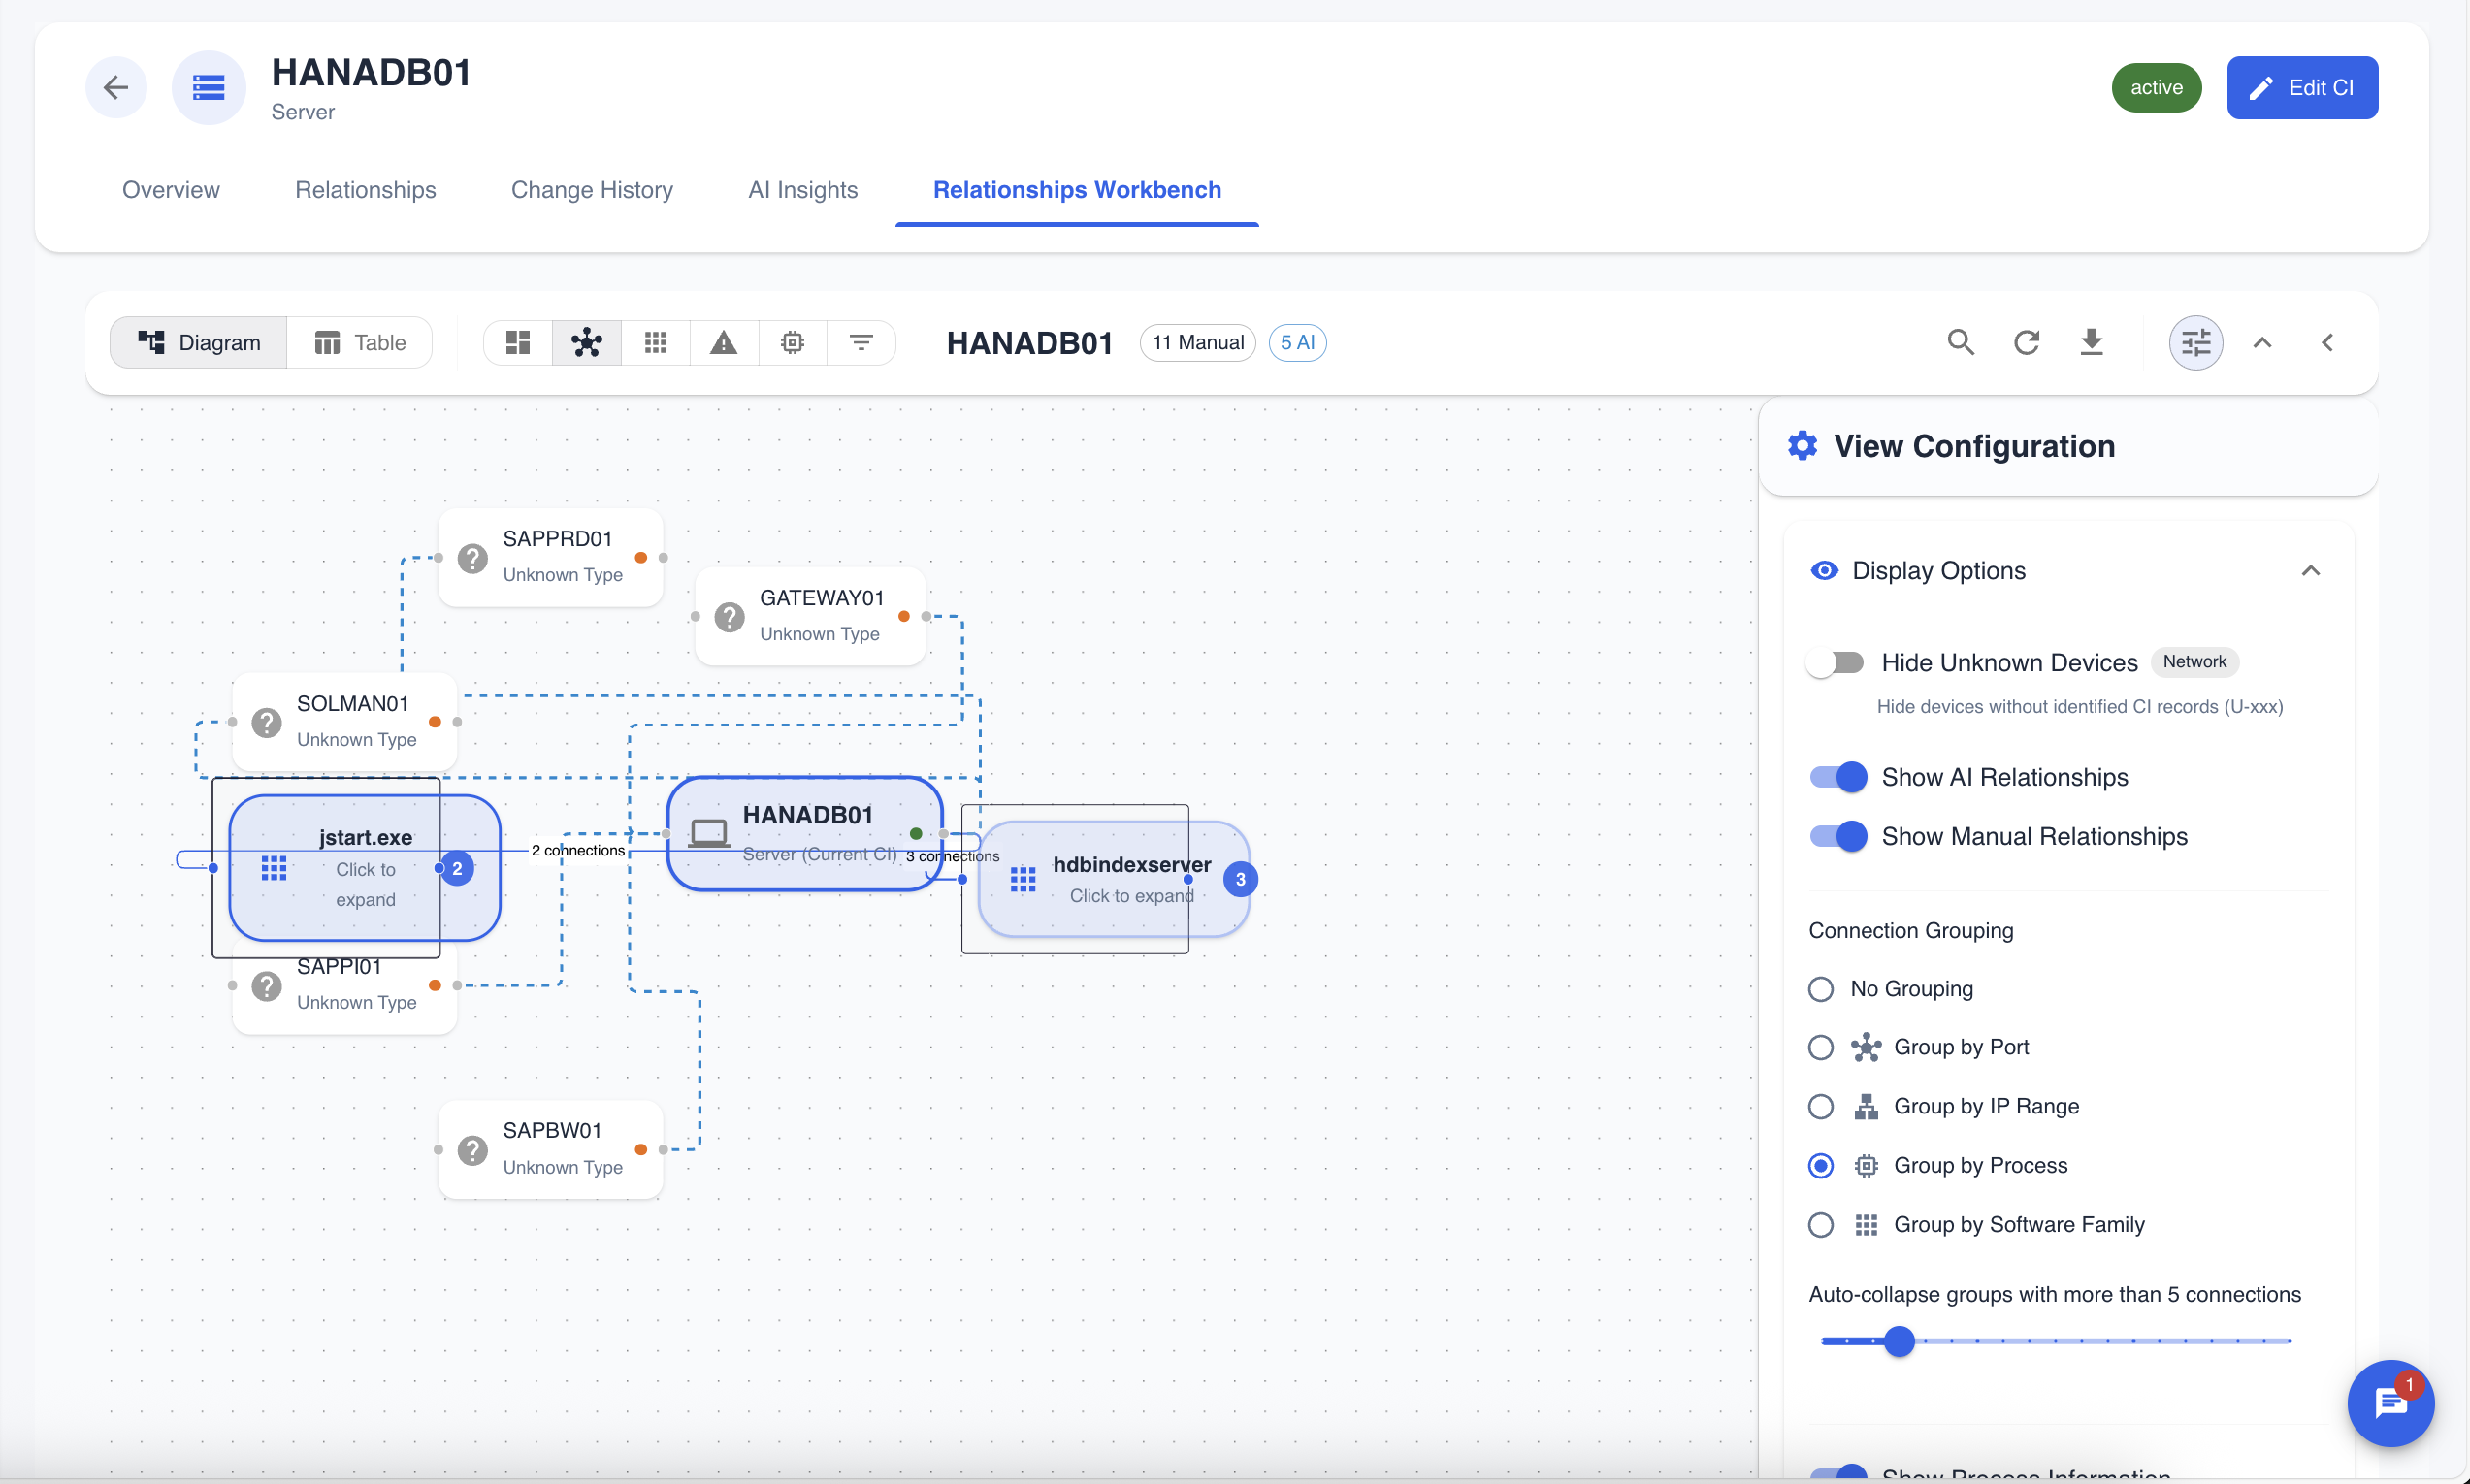 Figure 3: The diagram with software grouping enabled. Notice how multiple database instances are collapsed into a single "Database Systems" group.
Use Case: When analyzing a server with dozens of installed applications, you can collapse them into logical groups like "Microsoft Office", "Security Tools", and "Development Tools" to easily understand the server's role.
Focused Analysis with Diagram Modes
Beyond grouping, the workbench provides several diagram modes to focus your analysis on specific types of connections. This allows you to analyze relationships by network, process, or other criteria.
- Network Mode: This mode displays only the raw network connections (TCP/UDP) between CIs. It's essential for understanding network topology and can be used to analyze connections by network range or protocol.
- Application Dependency (Process) Mode: This provides a granular, process-level view of dependencies. It helps you understand exactly which processes on different machines are communicating, which is invaluable for application troubleshooting and dependency mapping.
- Filter & Analysis Mode: This powerful mode allows you to build complex filters to isolate very specific CIs or connections for deep analysis.
Event Impact Analysis
The workbench can integrate with the Event Management module to visualize the potential impact of an active event. By switching to the "Event Impact" mode, the diagram highlights the CIs affected by the event and their dependencies.
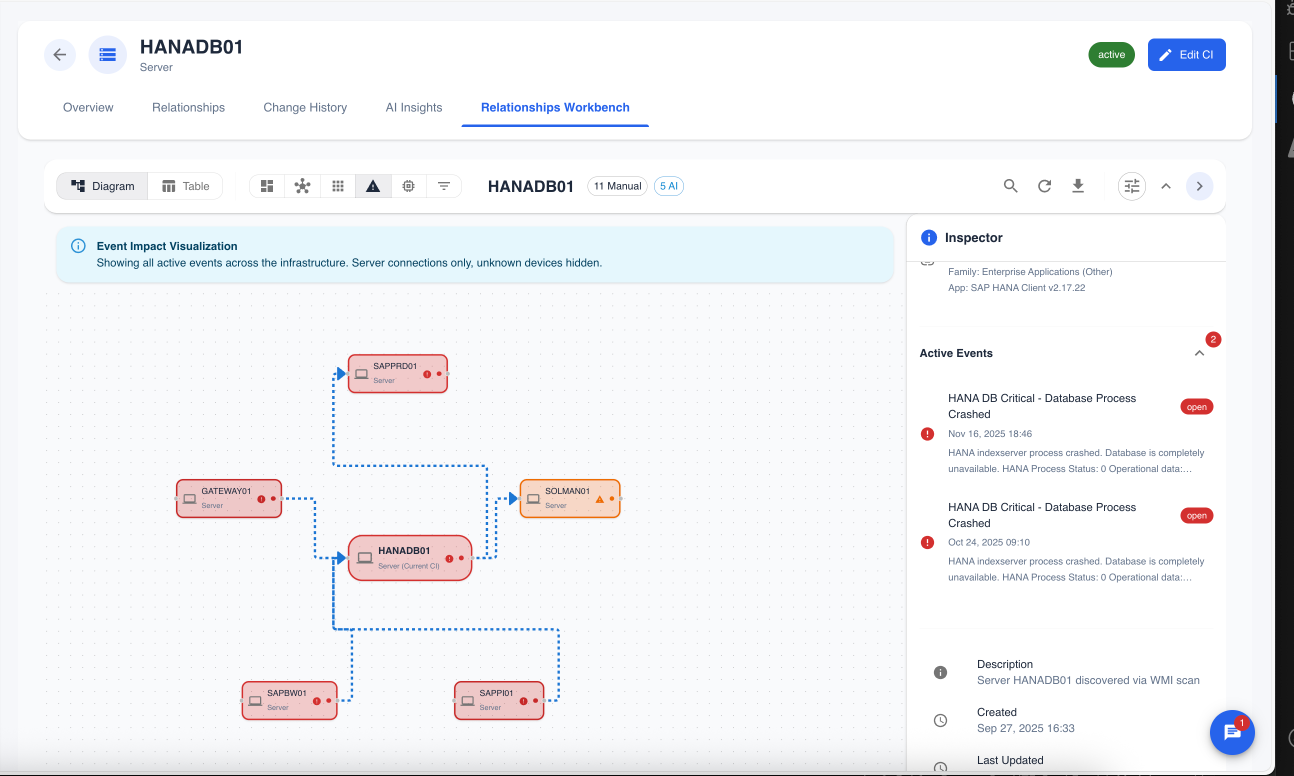 Figure 4: The Event Impact view, highlighting a critical event on a server and showing all the other CIs that may be affected by it.
Use Case: When a critical alert is received for a server, an operator can immediately use this view to understand which business services, applications, and users might be impacted, allowing for faster incident response and more accurate communication.
Application Dependency Mapping (ADM)
For a more granular view, the "Application Dependency Mapping" mode shows process-level dependencies. This allows you to see exactly which processes on different servers are communicating with each other.
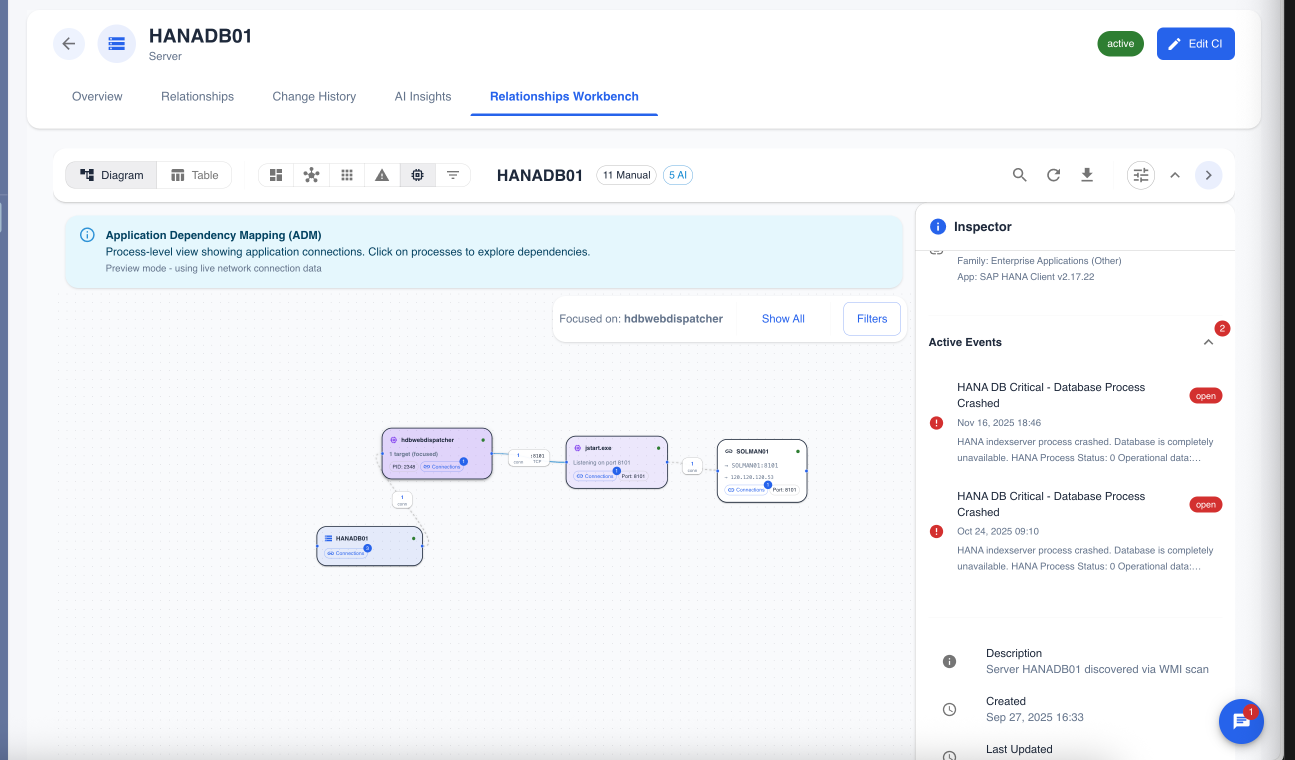 Figure 5: The ADM view, showing connections between specific processes like
 java.exe and sqlservr.exe.
Use Case: When troubleshooting an application performance issue, a developer or SRE can use this view to trace the flow of communication from the application process to the database process, helping to pinpoint network latency or configuration issues between them.
Advanced Filtering and Analysis
The workbench includes a powerful filtering engine that allows you to slice and dice the relationship data. You can filter by CI type, relationship type, AI confidence scores, and more.
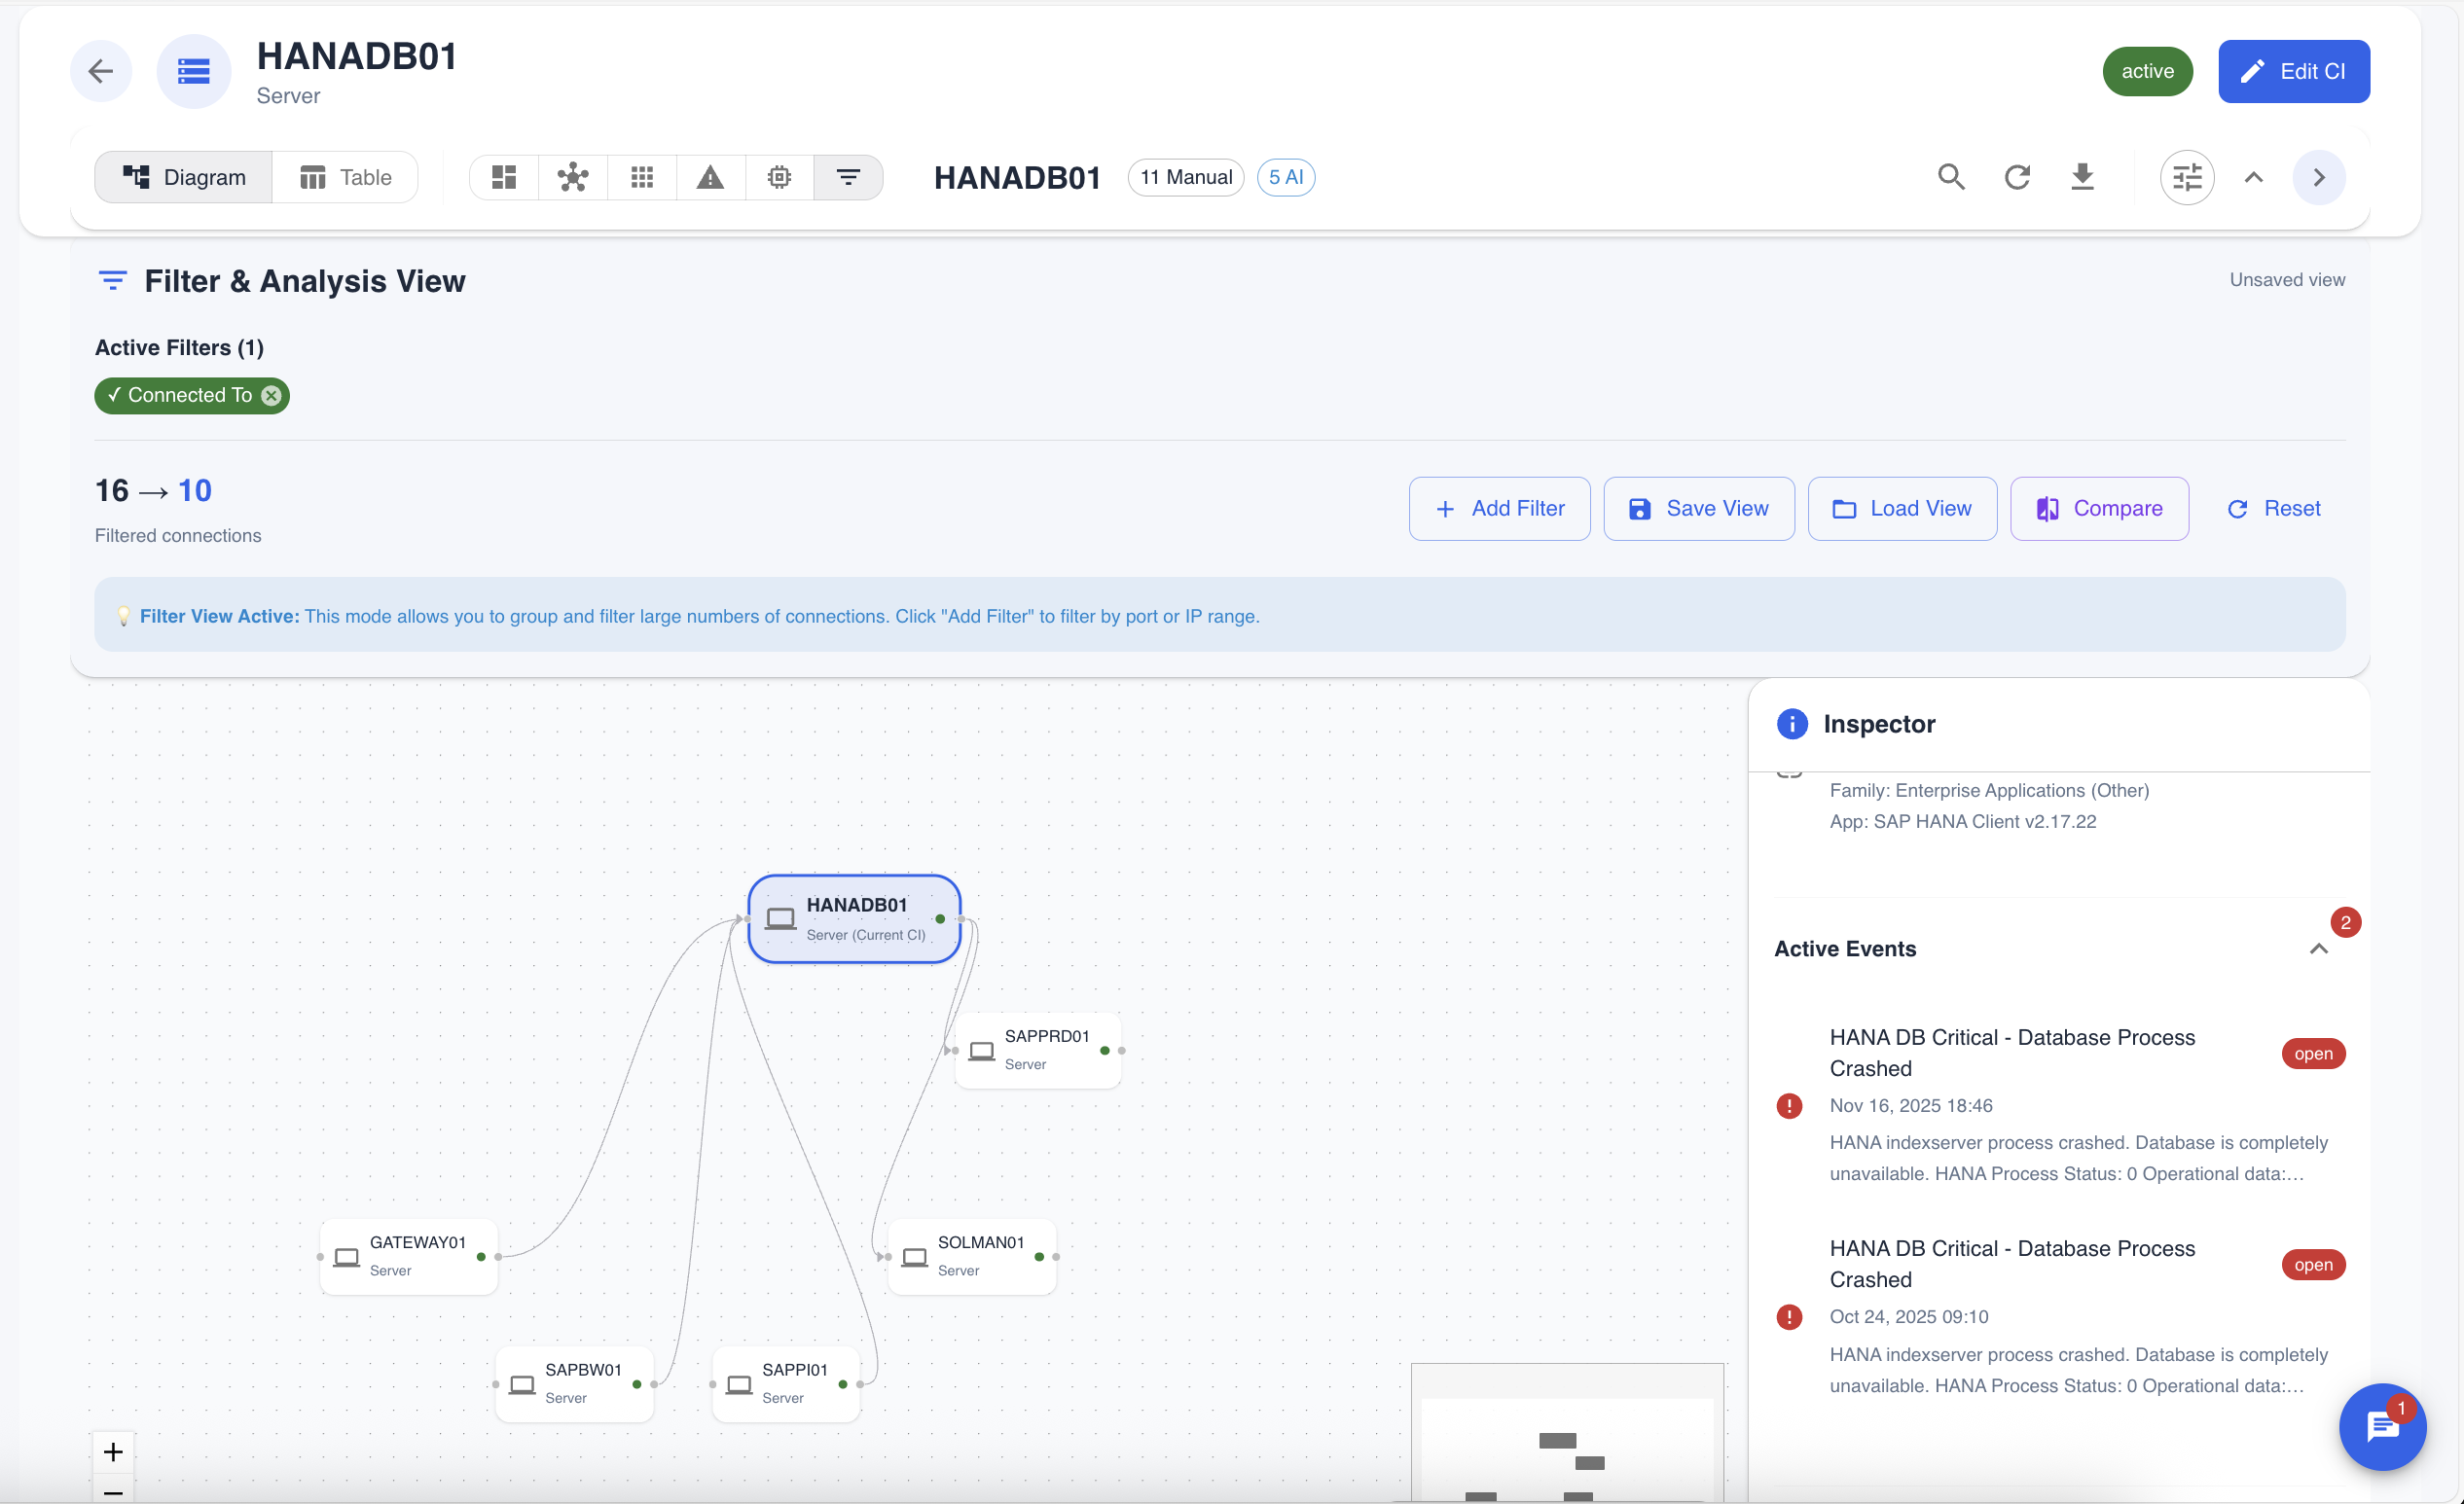 Figure 6: Using the Filter & Analysis view to isolate specific types of connections, in this case, showing only connections to a specific database.
Use Case: A security analyst can use the filtering tools to find all servers that have an open connection to the public internet on a non-standard port, helping to identify potential security risks.
Advanced Capabilities
Beyond visualization, the CI Workbench offers several advanced features:
- Semantic Search: A natural language search bar allows you to ask questions like "Show me all databases in production" and have the workbench automatically filter the view.
- Saved Workspaces: You can save your customized views—including filters, node positions, and panel layouts—as a named "workspace" for quick access later. This is perfect for creating preset views for common tasks like "Security Audit" or "Change Impact Analysis."
- Exporting: You can export the current view as an image (PNG, SVG) or export the underlying data as a CSV or JSON file for further analysis or reporting.