Global Infrastructure Workbench
The Global Infrastructure Workbench is your command center for visualizing, analyzing, and exploring your entire IT landscape. Unlike the CI Workbench which focuses on a single asset, the Global Workbench takes a "breadth-first" approach, allowing you to see macro-level dependencies, identify systemic risks, and trace complex connection paths across your entire organization.
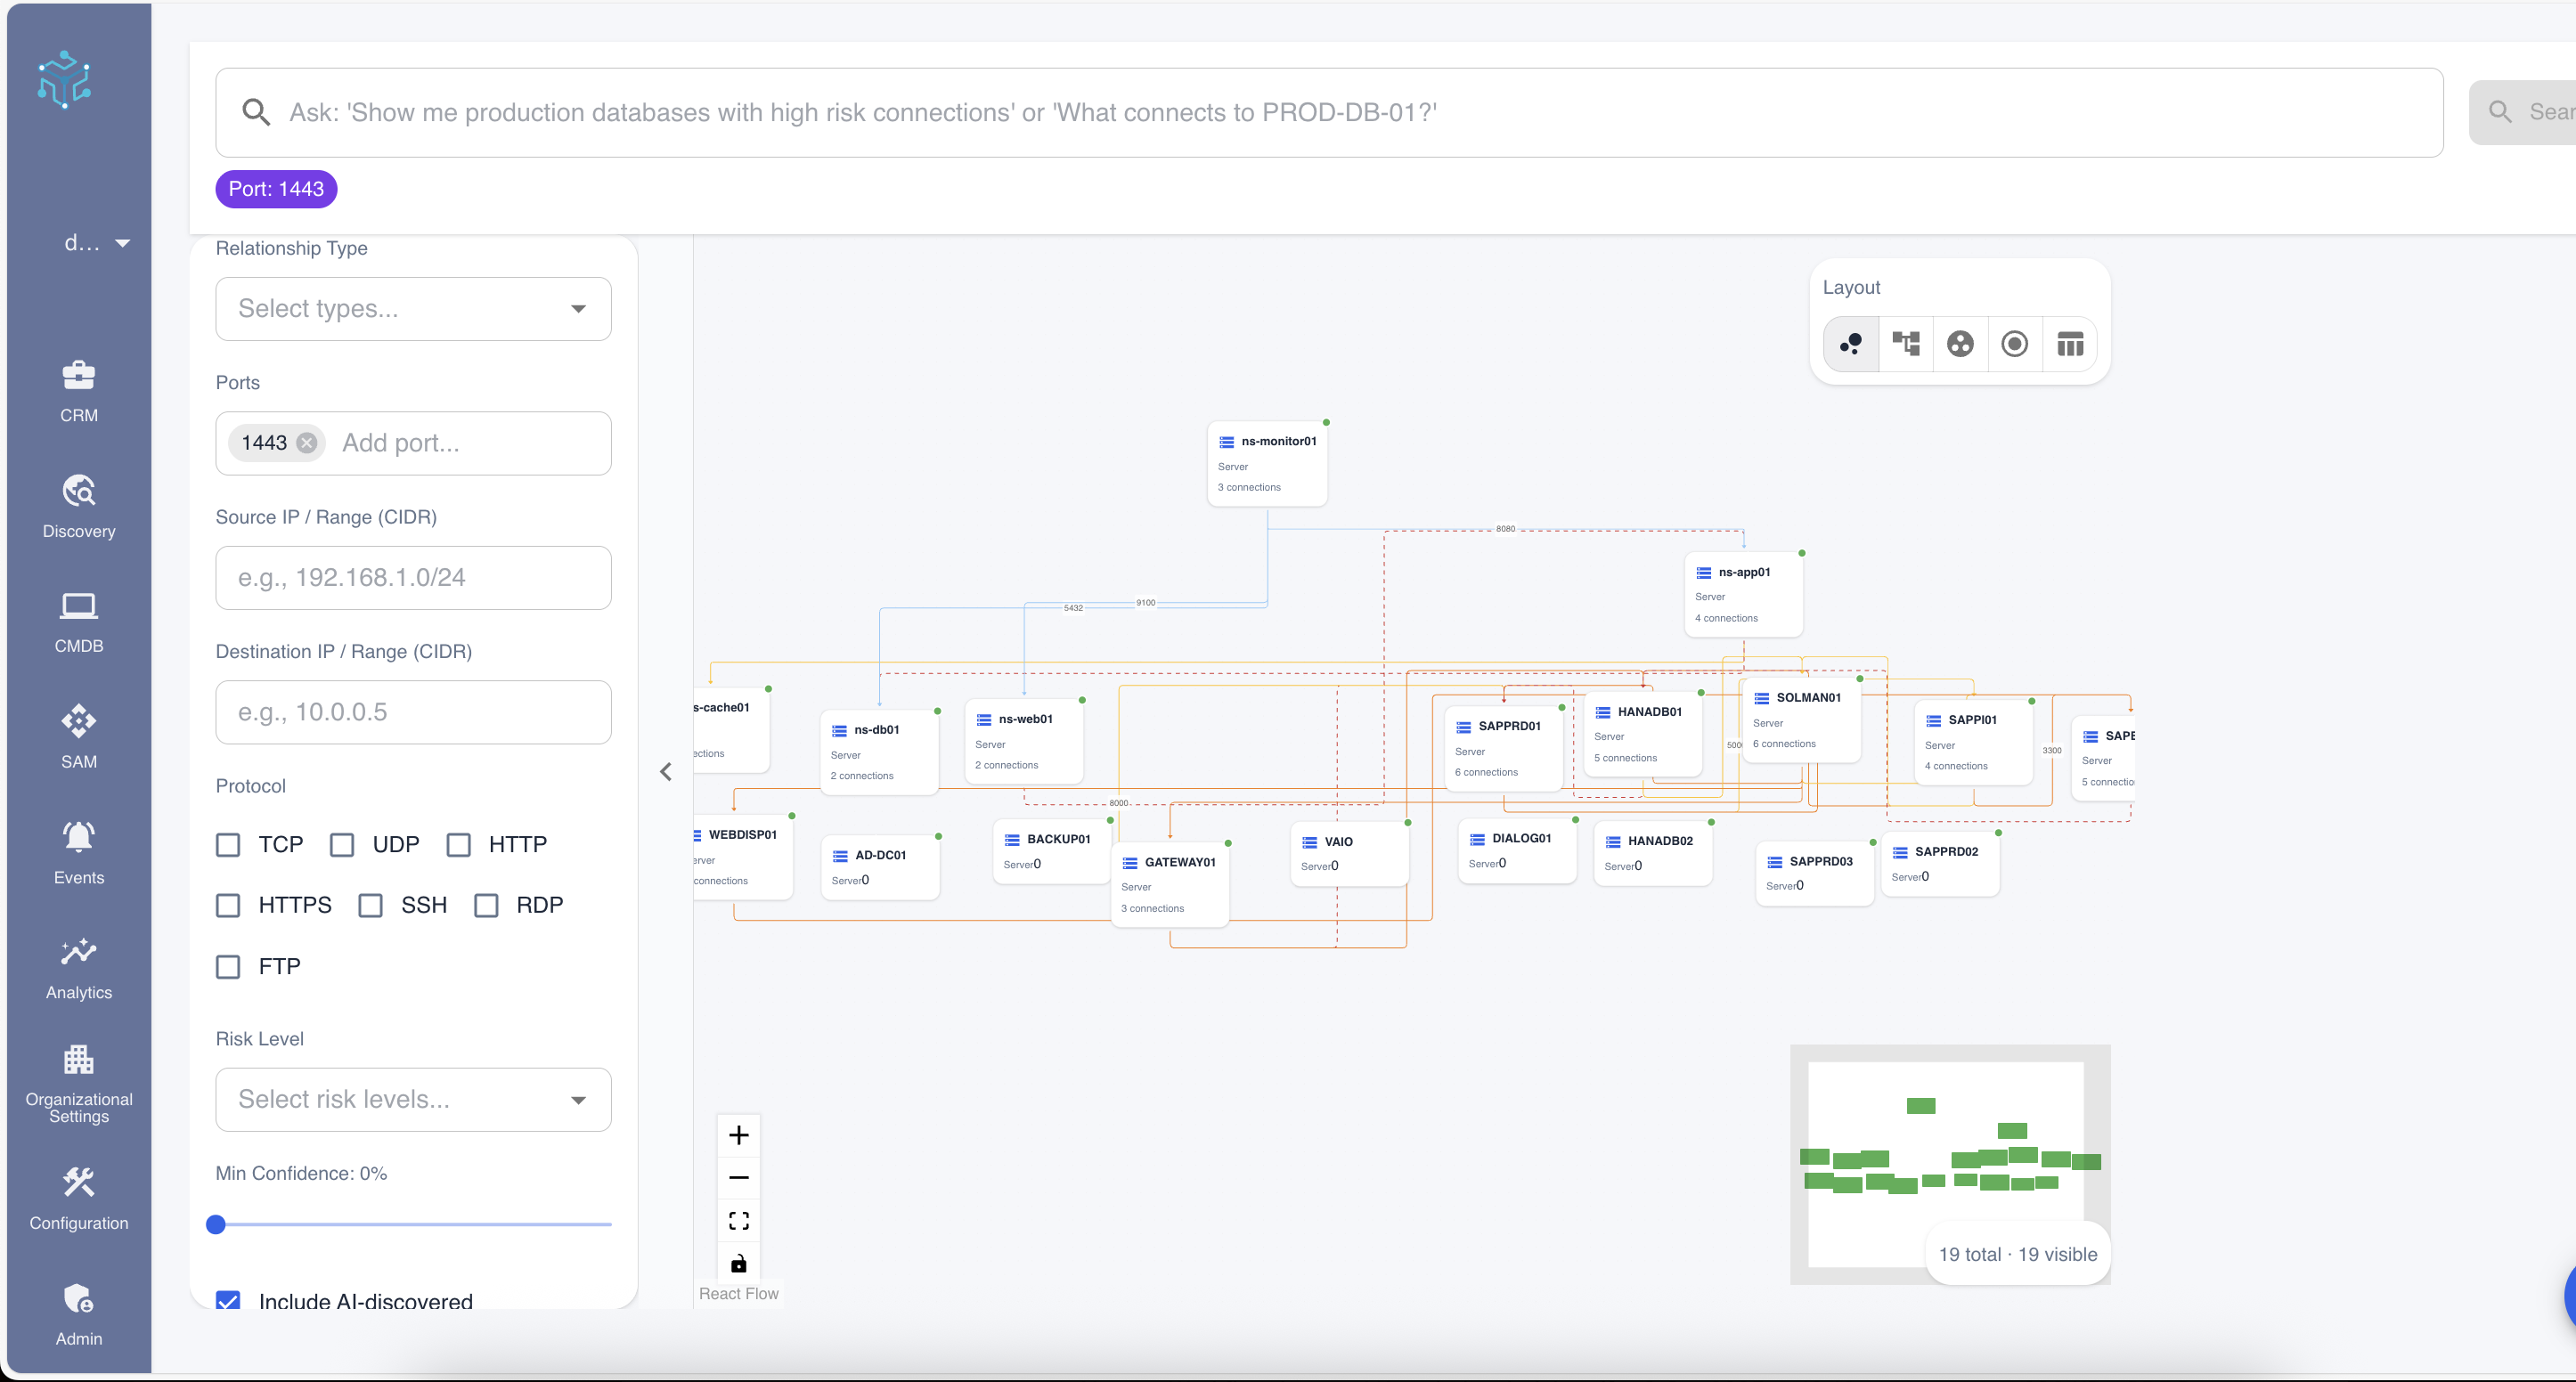
 Figure 1: The Global Infrastructure Workbench interface showing a filtered view of the production environment.
Accessing the Workbench
To access the Global Infrastructure Workbench:
- Navigate to CMDB in the main menu.
- Select Infrastructure Workbench.
The AI Command Center
At the heart of the workbench is the AI Command Center. Instead of manually clicking dozens of filters, you can simply ask questions in plain English. The AI translates your intent into a precise graph visualization.
Try asking questions like:
- "Show me all production databases connected to public-facing web servers."
- "Highlight servers with critical vulnerabilities and their dependencies."
- "Map the connections between the New York and London data centers."
- "What connects to SOLMAN01 on port 1521?"
 Figure 2: Using natural language to filter the topology graph.
When you submit a query, the system will:
- Parse your intent: Identify the specific CIs, environments, and relationship types you are interested in.
- Apply Filters: Automatically configure the advanced filter panel.
- Update Graph: Render the relevant nodes and connections.
- Highlight Matches: Apply a "Gold Glow" effect to the specific assets mentioned in your query.
Advanced Filtering
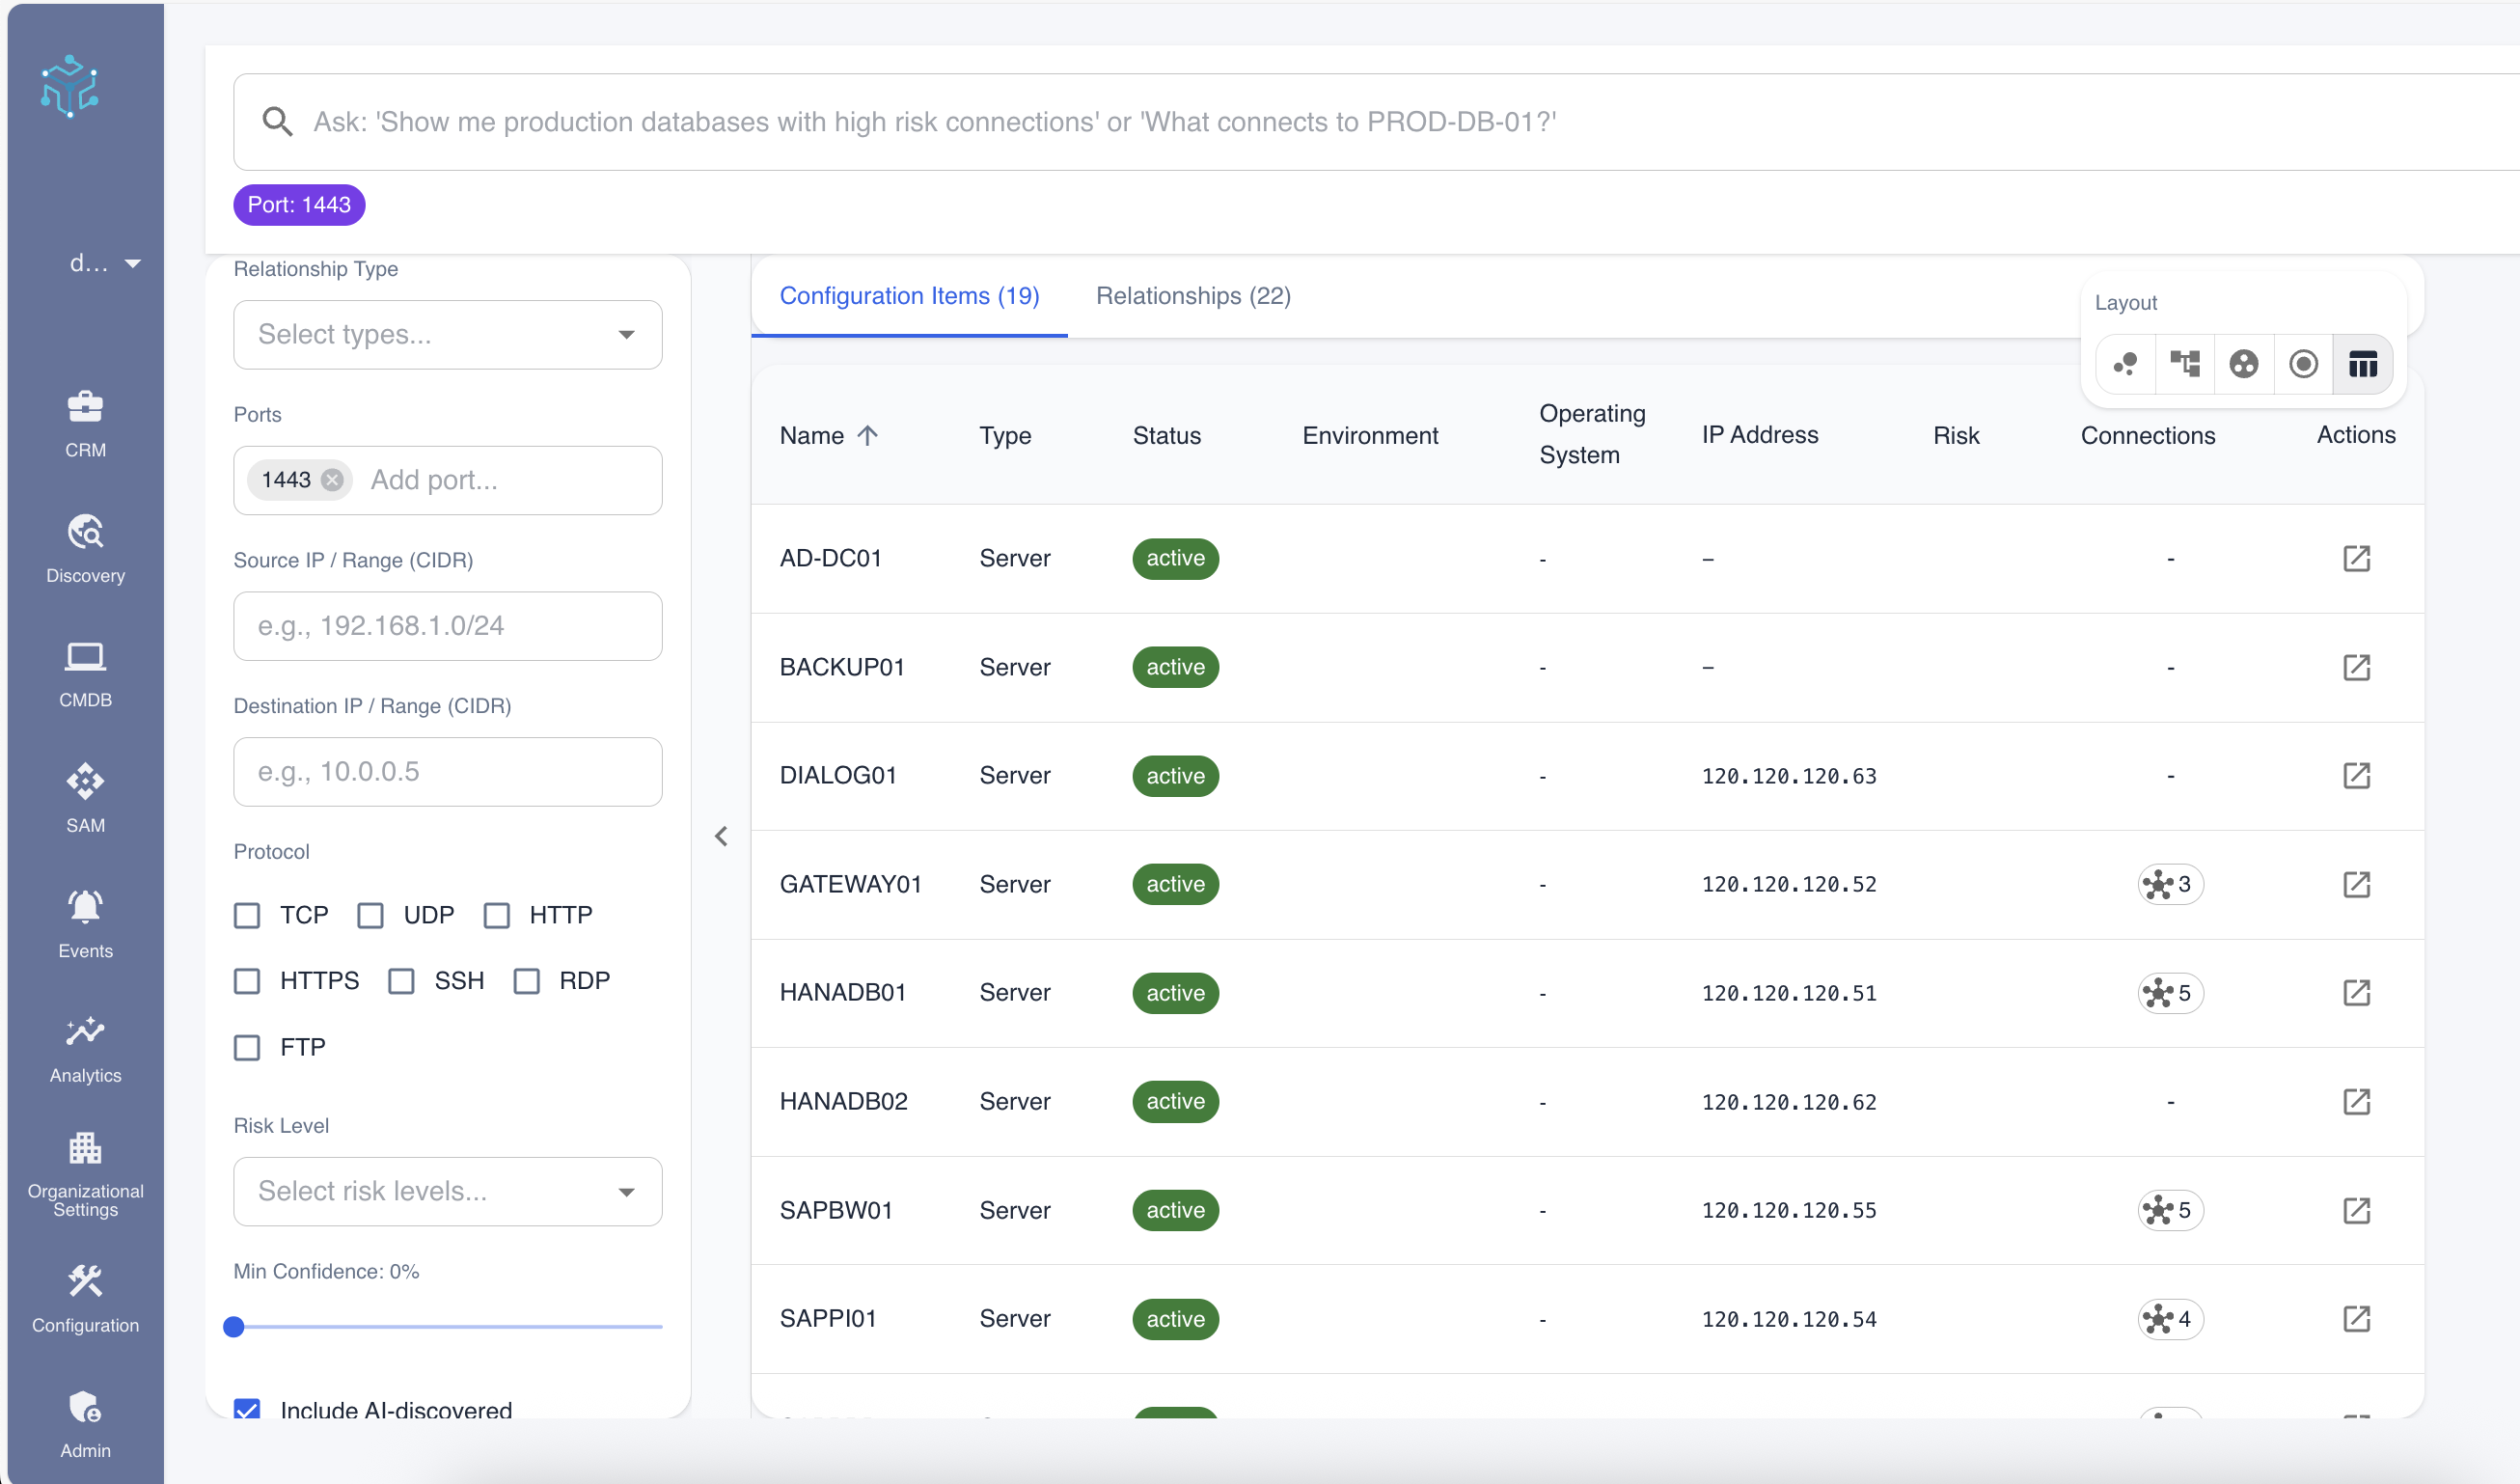
For granular control, the collapsible Filter Panel on the left allows you to slice and dice the infrastructure data.
CI Filters
- CI Type: Filter by specific asset classes (e.g., Server, Database, Network Device).
- Status: Isolate Active, Maintenance, or Inactive assets.
- Environment: Focus on Production, Staging, or DR environments.
- IP Range: Enter a CIDR block (e.g.,
10.0.0.0/8) to show only assets within a specific network segment. - Data Classification: Filter assets handling sensitive data like PHI or PCI.
Relationship Filters
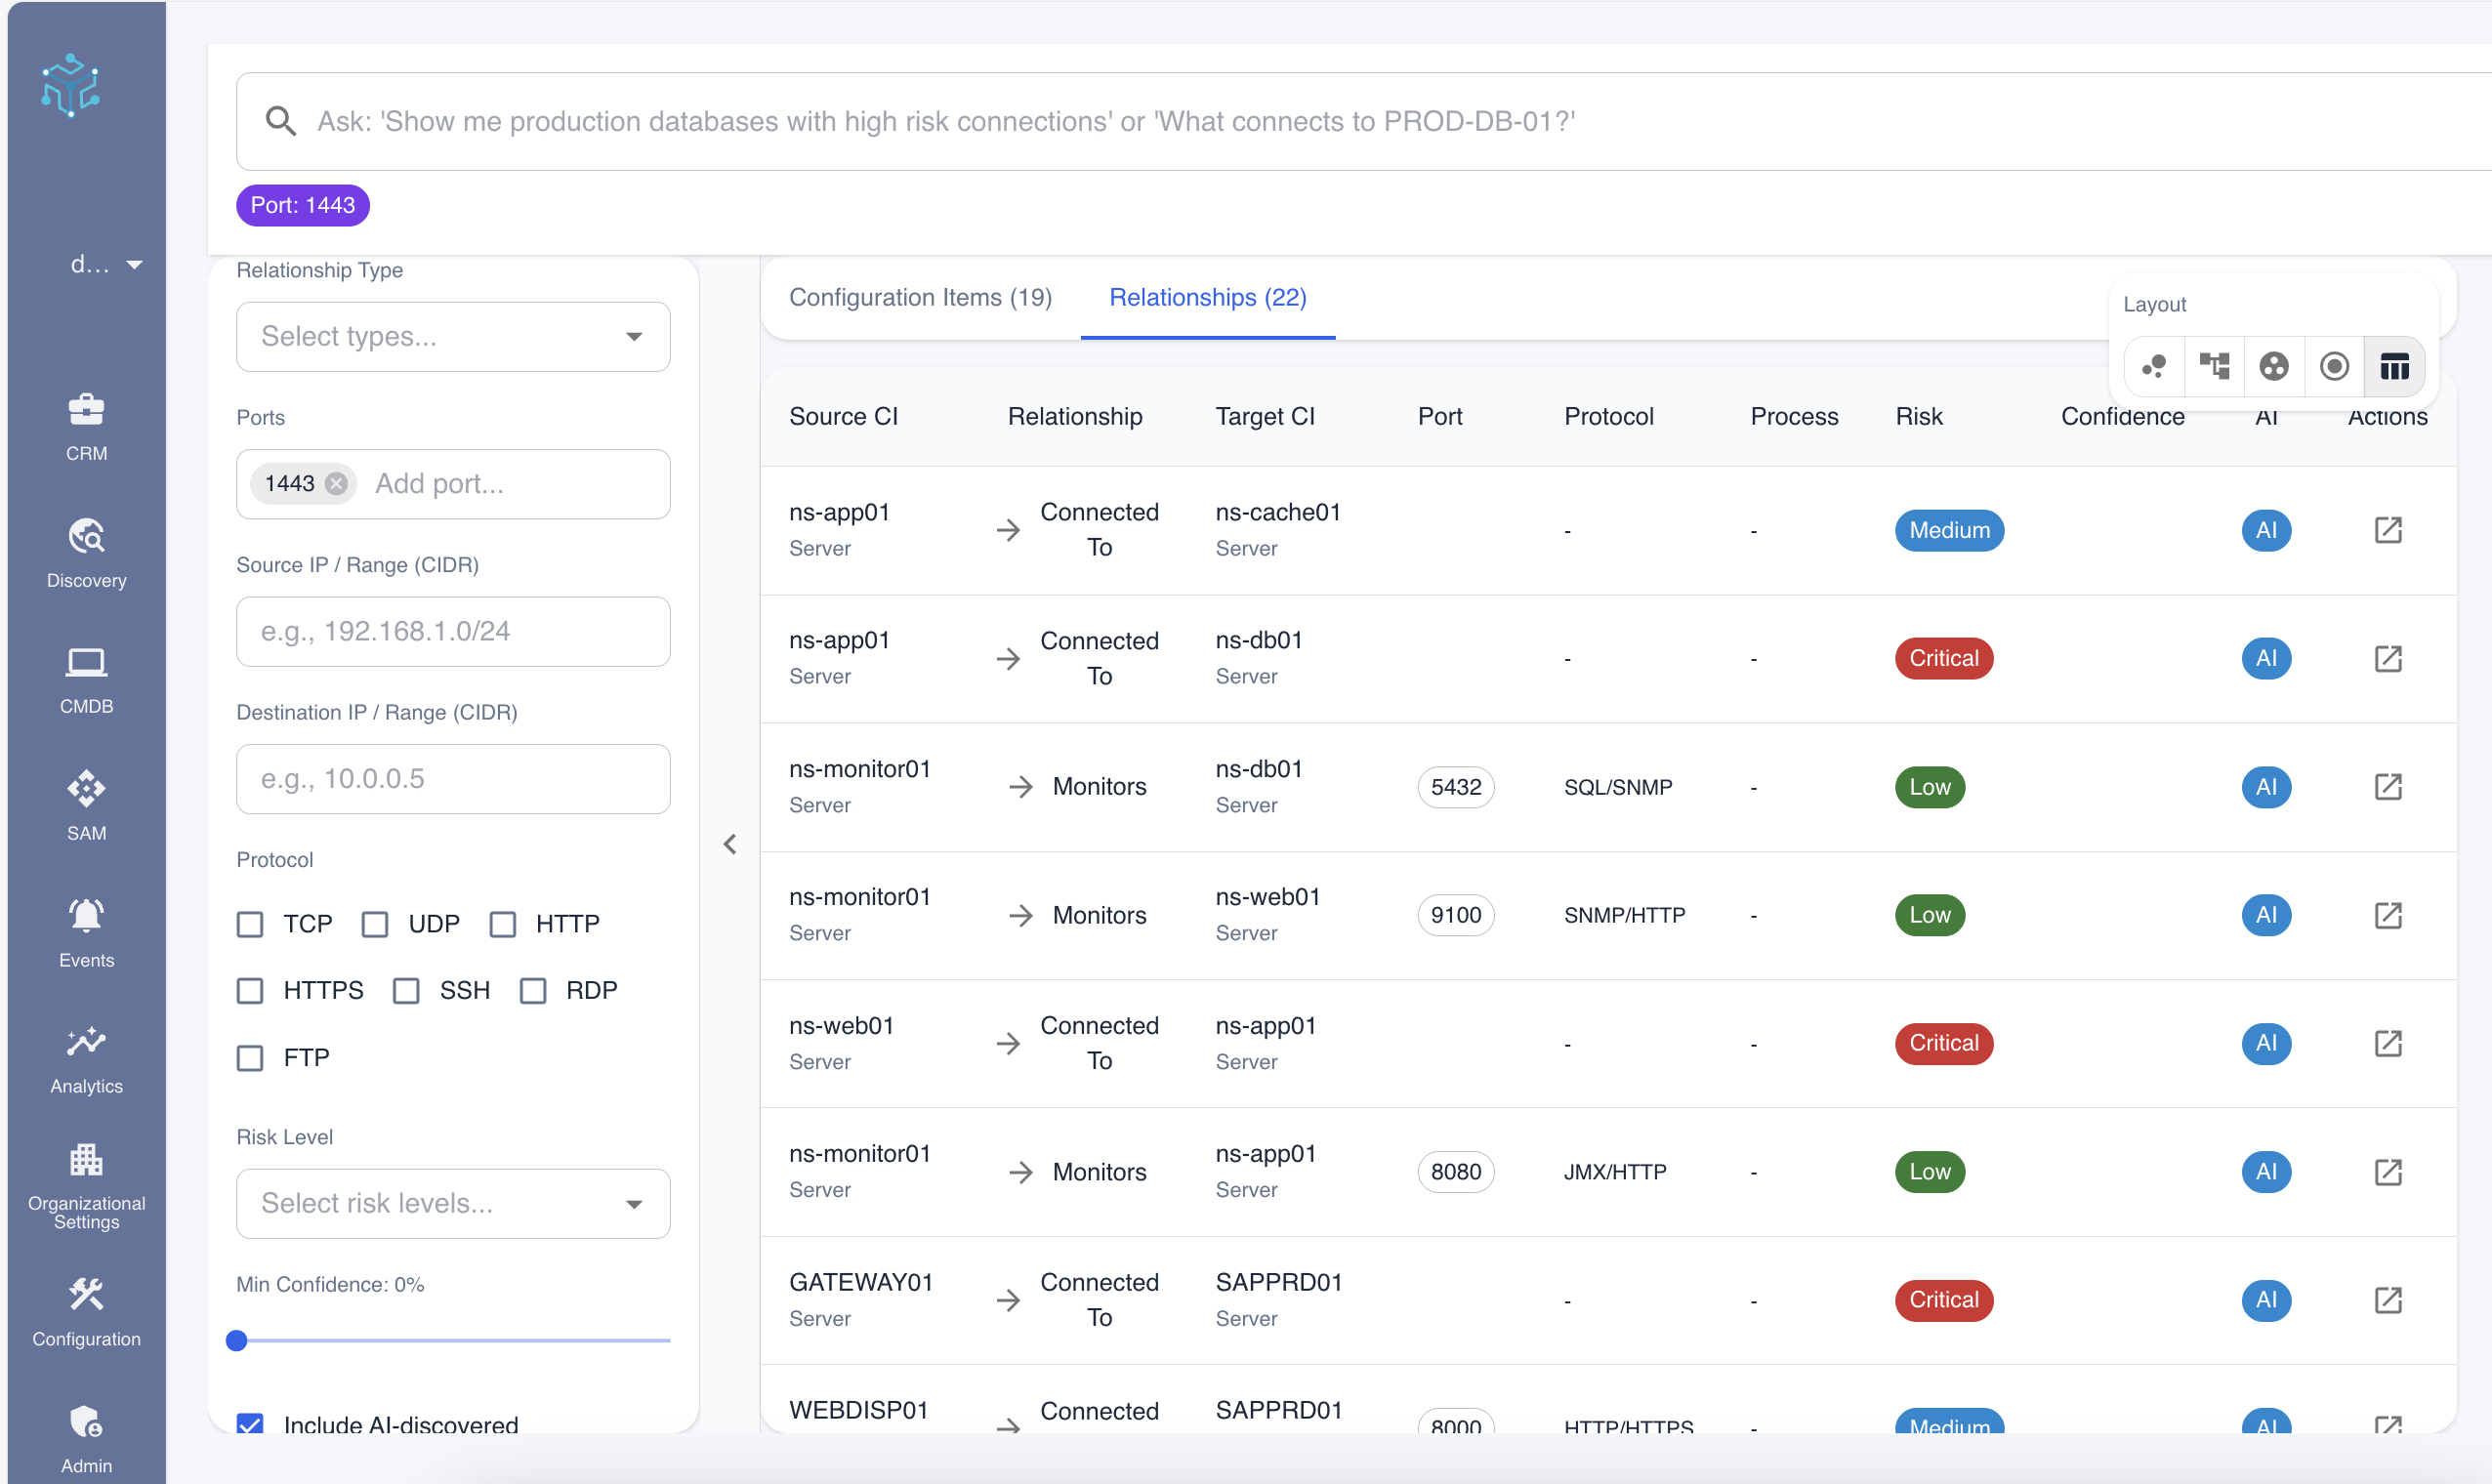
This unique feature allows you to filter the connections themselves, not just the nodes.
- Port/Protocol: Show only traffic on specific ports (e.g.,
443,1433). - Connection Type: Toggle between Manual relationships and AI-Discovered connections.
- Risk Level: Filter connections by their AI-assessed risk (Critical, High, Medium, Low).
- Source/Target IP: Trace traffic flows between specific IP addresses.
The Interactive Graph
The central visualization canvas is designed to handle thousands of nodes without becoming a "hairball."
Smart Clustering
To maintain readability, the workbench automatically groups similar "leaf nodes" (endpoints with only one connection) into Clusters.
- Visual: Represented by a blue folder icon with a count badge (e.g., "15 Workstations").
- Interaction: Click a cluster to Explode it, revealing the individual nodes. Click the "Layout" refresh button to re-cluster.
 Figure 3: A cluster of workstations (left) and a detailed server dependency map (right).
Layout Modes
Switch between layouts to answer different questions:
- Force Directed: (Default) Organic layout. Best for discovering natural clusters and isolated islands.
- Hierarchical: Tree-like structure (Top-to-Bottom). Best for understanding dependency chains (Application → Database → Storage).
- Grouped: Organizes nodes into visual boxes based on their Environment (e.g., all Production nodes in one box).
- Circular: Arranges nodes in a ring. Good for identifying central hubs.
Visual Encoding
The graph uses visual cues to convey status and risk instantly:
- Node Status: Green dot (Active), Red dot (Quarantine), Orange dot (Maintenance).
- Risk Level: Nodes and Edges with Critical Risk have a pulsing Red Border/Line.
- AI Confidence: AI-discovered relationships are rendered with dashed lines, while manual ones are solid.
Inspector Panel
Clicking any node or connection line opens the Inspector Panel on the right.
- CI Details: View key attributes (OS, IP, Location) and health metrics.
- Connection Details: See the specific process, port, and protocol enabling a connection.
- Quick Actions: One-click navigation to the full CI Details page or the localized CI Workbench.